
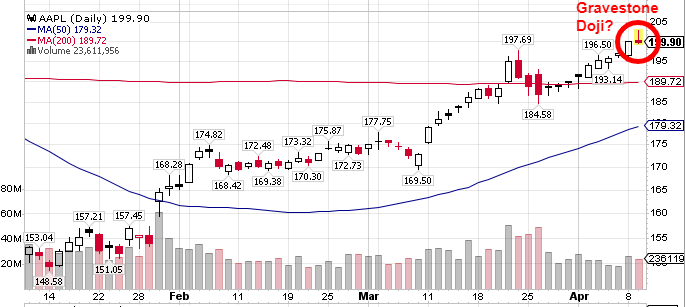
Apple, Inc. AAPL is in the middle of a major winning street on Wall Street, on the brink of closing higher for the tenth consecutive trading day. Apple hasn’t had a 10-day winning streak since 2010, but an early-afternoon sell-off has the winning streak and the entire rally in technical jeopardy.
Rally In Jeopardy
Apple's stock hasn’t had a down day since Tuesday, March 26. Since that time it has steadily climbed from under $186 to new 2019 highs above $200. After penetrating as high as $202.85 on Tuesday morning, Apple shares turned lower on the day, dropping back down below $200 and into red territory.
After such a long winning streak, Apple may be running into two technical problems on Tuesday.
First, the $200 level is a major psychological level for traders. Even though there may be nothing special going on in the stock’s chart at $200 and there’s no special valuation for the company at $200, traders often use these nice round numbers as exit points for winning trades, creating selling pressure and ultimately resistance.
To make matters worse, a nine-day winning streak really pumps up a stock’s RSI into extremely overbought territory. RSI is an indicator that a stock is due for a near-term pullback when it gets above 70, and Apple’s RSI is currently above 76.
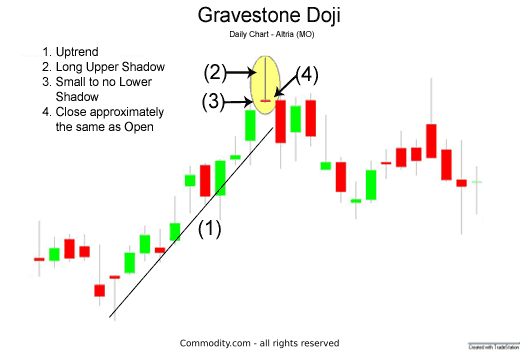
Gravestone Doji
While Apple investors are likely fine with one slightly down day after nine straight winners, Tuesday’s trading action may be creating a much more bearish medium-term candlestick signal. After an extended rally, a gravestone doji is formed when a stock’s open, daily low and closing price are all near each other, but the stock trades much higher throughout the day. This candlestick signal is often seen as a bearish reversal sign given that the long upper shadow represents an excess of sellers at the intraday high.
Even if Apple ends up closing slightly higher on Tuesday, it will still potentially form the gravestone doji unless it rallies into the close.
Key Technical Levels
Looking ahead, the key technical support levels to watch will be the 200-day simple moving average around $189 and the recent lows of around $185 in late March and $170 in early March.
If the rally continues, traders should watch for potential resistance at the $215 level that previously served as support in September and October of 2018. Apple is also potentially on the brink of a bullish golden cross of the 50-day and 200-day SMAs sometime in the coming weeks.
At time of publication, Apple's stock traded at $199.74 per share. The stock needs to close at $200.10 per share to avoid closing in the red.
Related Links:
How Much Damage Did Tusa's Downgrade Do To GE's Technical Picture?
Apple As A Service: Analysts Break Down Apple TV+, Apple News+ And Apple Arcade
© 2025 Benzinga.com. Benzinga does not provide investment advice. All rights reserved.
Trade confidently with insights and alerts from analyst ratings, free reports and breaking news that affects the stocks you care about.

