

Gold’s rallying days appear to be numbered based on its self-similar pattern. Gold is moving almost exactly as it’s been moving between 2011 and mid-2013. The current moves are much faster but other than that, history appears to be repeating itself, and the implications are bearish.
Let’s take a look at gold’s chart for details.
The odd thing about the chart is that it actually consists of two charts. I copied the most recent movement in gold and pasted it above gold’s 2011 – 2013 performance. Admit it – at first glance, it was clear to you that both price moves were very similar.
And that’s exactly my point. History tends to rhyme and that’s one of the foundations of technical analysis in general. Retracements, indicators, cycles, and other techniques are used based on this very foundation – they are just different ways to approach the recurring nature of events.
However, every now and then, history repeats itself to a much greater degree than is normally the case. In extremely rare cases, we get a direct 1:1 similarity, but in some (still rare, but not as extremely rare) cases we get a similarity where the price is moving proportionately to how it moved previously. That’s called self-similarity.
After taking a brief look at the chart, you probably instinctively knew that since the price moves are so similar this time, then the follow-up action is also likely to be quite similar. In other words, if something looks like a duck, and quacks like a duck, it’s probably a duck. And it’s likely to do what ducks do.
What did gold do back in 2013 at the end of the self-similar pattern? Saying that it declined is true, but it doesn’t give the full picture - just like saying that the U.S. public debt is not small. Back then, gold truly plunged. And before it plunged, it moved lower in a rather steady manner, with periodic corrections. That’s exactly what we see right now.
At the moment of writing these words (early on December 3), gold hasn’t moved back to its September lows, but it’s quite close to them. This level served as strong support previously, so it’s now likely to serve as strong resistance. This means that the corrective upswing is quite likely to be over rather soon.
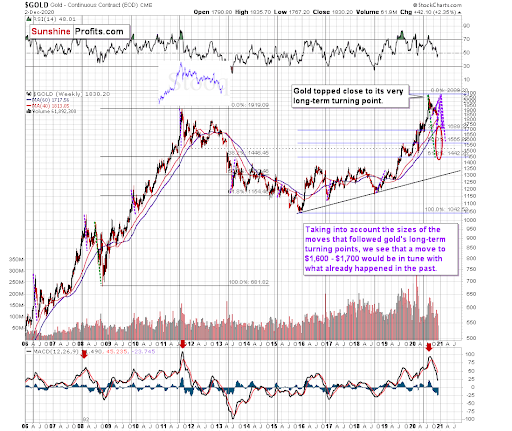
Before moving to the second point, please note that the above chart shows gold’s very long-term turning points (vertical lines) and we see that gold topped a bit after it (not much off given their long-term nature). Based on how gold performed after previous long-term turning points (marked with purple, dashed lines), it seems that a decline to even $1,600 would not be out of the ordinary.
Finally, please note the strong sell signal from the MACD indicator in the bottom part of the chart. The only other time when this indicator flashed a sell signal while being so overbought was at the 2011 top. The second most-similar case is the 2008 top.
The above-mentioned self-similarity covers the analogy to the 2011 top, but what about the 2008 performance?
If we take a look at how big the final 2008 decline was, we notice that if gold repeated it (percentage-wise), it would decline to about $1,450. Interestingly, this would mean that gold would move to the 61.8% Fibonacci retracement level based on the entire 2015 – 2020 rally. This is so interesting because that’s the Fibonacci retracement level that (approximately) ended the 2013 decline.
History tends to rhyme, so perhaps gold is going to decline even more than the simple analogy to the previous turning points indicates. For now, this is relatively unclear, and my target area for gold’s final bottom is quite broad.
Summing up, while the ultimate downside target for gold is relatively unclear, it’s quite clear that, based on gold’s self-similar pattern, the outlook for gold for the next several weeks remains bearish despite the current corrective upswing.
Przemyslaw Radomski, CFA is the Founder and Editor-in-chief of Sunshine Profits
All essays, research and information found above represent analyses and opinions of Przemyslaw Radomski, CFA and Sunshine Profits' associates only. As such, it may prove wrong and be subject to change without notice. Opinions and analyses are based on data available to authors of respective essays at the time of writing. Although the information provided above is based on careful research and sources that are deemed to be accurate, Przemyslaw Radomski, CFA and his associates do not guarantee the accuracy or thoroughness of the data or information reported. The opinions published above are neither an offer nor a recommendation to purchase or sell any securities. Mr. Radomski is not a Registered Securities Advisor. By reading Przemyslaw Radomski's, CFA reports you fully agree that he will not be held responsible or liable for any decisions you make regarding any information provided in these reports. Investing, trading and speculation in any financial markets may involve high risk of loss. Przemyslaw Radomski, CFA, Sunshine Profits' employees and affiliates as well as members of their families may have a short or long position in any securities, including those mentioned in any of the reports or essays, and may make additional purchases and/or sales of those securities without notice.
© 2025 Benzinga.com. Benzinga does not provide investment advice. All rights reserved.
Trade confidently with insights and alerts from analyst ratings, free reports and breaking news that affects the stocks you care about.

