


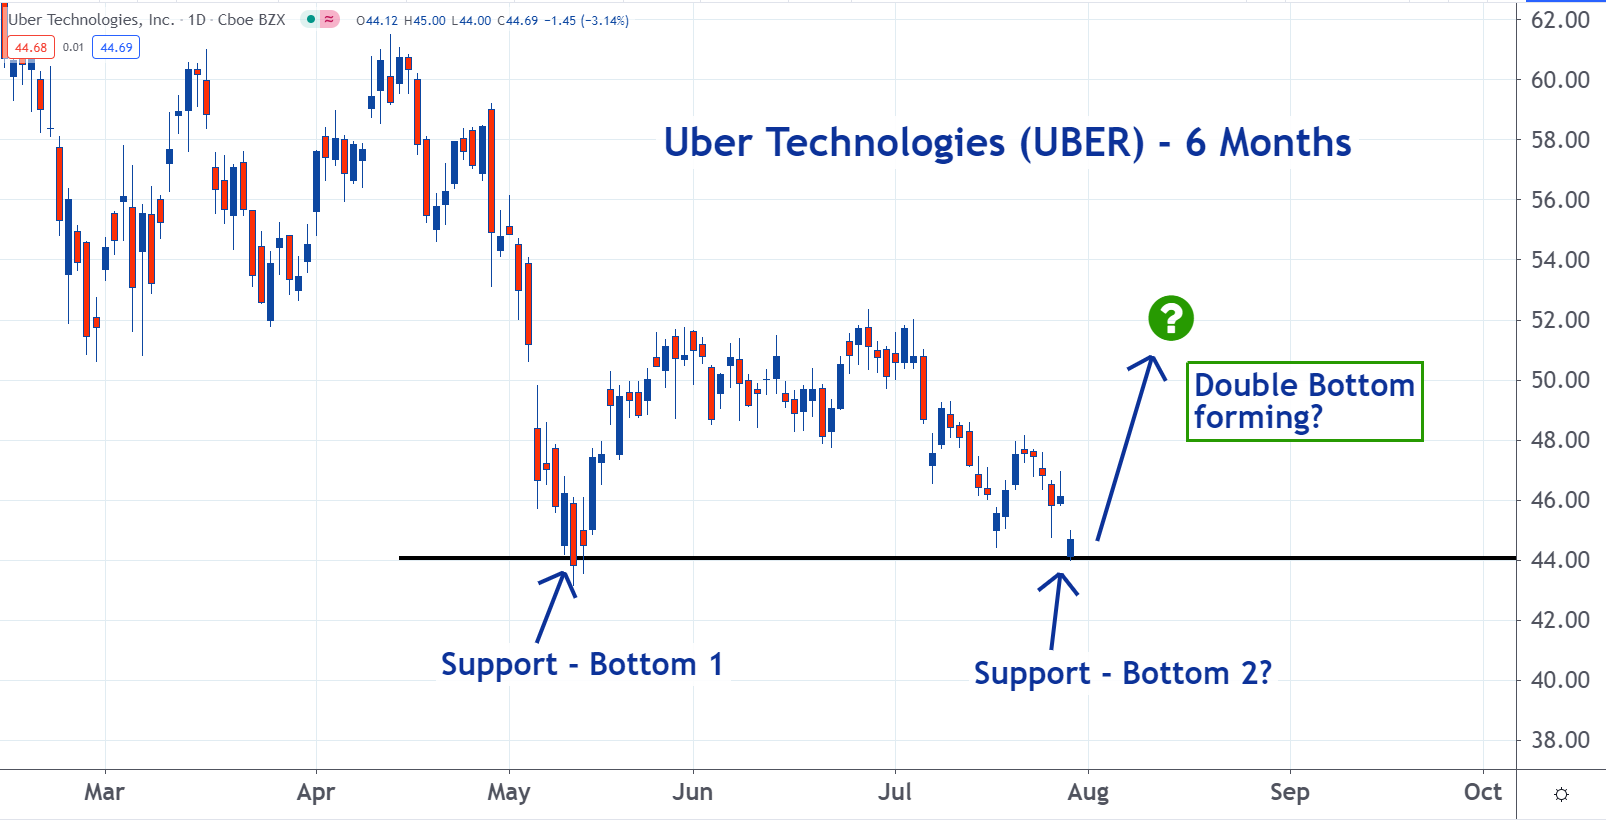
Shares of Uber Technologies, Inc. UBER may be forming a classic double bottom pattern. And if that’s the case, it could be a good time to buy them.
A double bottom pattern forms on a chart when a stock revisits a level that it has previously rallied off of. In this case, it’s $44. The level was support. There was enough demand to absorb all of the supply.
When the stock trends lower and reaches this level a second time, there is a good chance there is still a significant demand for it. If so, shares could rally again and complete the pattern.
Edge Rankings
Price Trend
© 2025 Benzinga.com. Benzinga does not provide investment advice. All rights reserved.
Trade confidently with insights and alerts from analyst ratings, free reports and breaking news that affects the stocks you care about.

