


Amazon.com, Inc. AMZN closed 2.8% higher on Tuesday despite its cloud computing arm, AWS, suffering an outage that affected multiple services across the U.S. East Coast.
Streaming services such as Netflix Inc NFLX and Walt Disney Co.’s DIS Disney+ were disrupted and Disney's theme parks were affected, with some guests unable to enter them. Airlines such as Delta Airlines, Inc. DAL and Southwest Airlines Co LUV reported difficulties with their reservation systems. And, a number of Amazon’s offerings such as its Ring smart doorbell, Alexa virtual assistant and its Amazon Music Service were also impacted.
The outage highlighted the risks involved with cloud computing and the chaos that can be caused when the technology experiences a glitch.
In the premarket on Wednesday, Amazon was trading flat in line with the Nasdaq, which attempted to bust up through a heavy resistance level at $16,436.30 at 6:45 a.m. EST and failed. For Amazon to make another attempt at breaking through resistance at the $3,550 level, the Nasdaq will likely need to regain its own key level as support.
See Also: This Company Wants to Help Bring Blockchain Technology to Healthcare
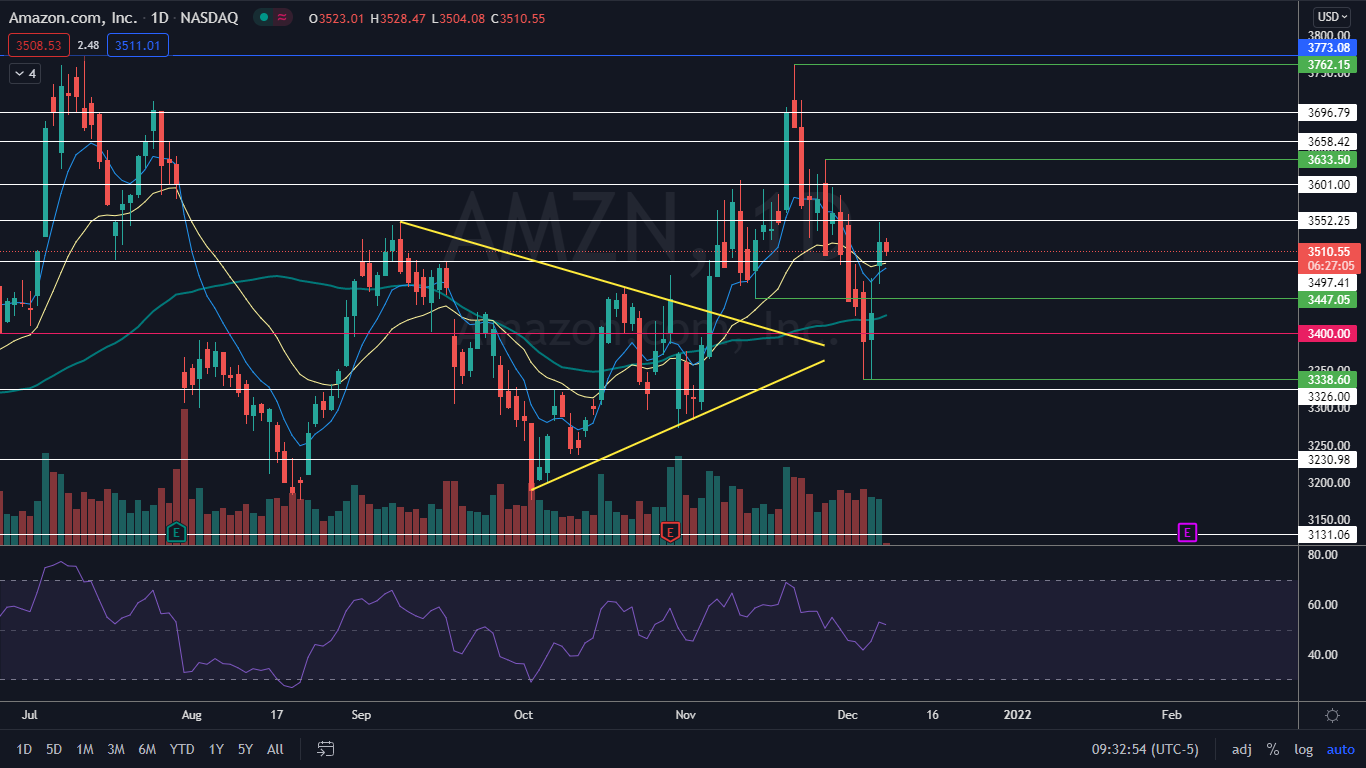
The Amazon Chart: On Nov. 19, Amazon made a run toward its July 13 all-time high of $3,773.08 but was unable to get momentum on the move for a blue sky run. The failed attempt created a bearish double top pattern near the level and Amazon subsequently entered into a downtrend.
In its downtrend, Amazon made a consistent series of lower highs and lower lows before finding a bottom on Dec. 3 at the $3,338.60 level and bouncing up from it. Amazon then tested the level as support on Dec. 6 and again wicked from the level, which created a bullish double bottom pattern.
On Tuesday, Amazon reacted bullishly to the pattern and traded higher but not high enough to signal a trend change may be in the works. The stock will need to close up above the most recent lower high at $3,633.50 or print a higher low above Monday’s low-of-day to indicate an uptrend may begin.
Amazon is trading above the eight-day and 21-day exponential moving averages (EMAs) but with the eight-day EMA trending slightly below the 21-day. If the eight-day is able to cross above the 21-day EMA it will be bullish. The stock is trading over the 50-day simple moving average, which indicates longer-term sentiment is bullish.
- Bulls want to see big bullish volume come in and push Amazon up through $3.550 and for momentum to then carry the stock up to make a higher high, keeping in mind a higher low may be needed before that happens. Above the level, there is resistance at $3,601 and $3,658.42.
- Bears want to see big bearish volume come in and drop Amazon through support near the $3,500 level. If the stock is unable to hold above the area, Amazon could retest psychological support at $3,400.
Want direct analysis? Find me in the BZ Pro lounge! Click here for a free trial.
Photo: Christian Wiediger via Unsplash
© 2025 Benzinga.com. Benzinga does not provide investment advice. All rights reserved.
Trade confidently with insights and alerts from analyst ratings, free reports and breaking news that affects the stocks you care about.

