
On Sunday evening, Benzinga asked its followers on Twitter what stock they’re buying at the open on Monday? From the replies Benzinga selected one ticker for technical analysis.
@CblastBT is buying Amazon.com, Inc AMZN.
Amazon was trading slightly higher in the premarket on Monday in unison with the SPDR S&P 500 SPY despite its Edwardsville, Illinois warehouse collapsing on Friday as intense storms ripped across a number of midwestern states.
The collapse took the life of at least six people and brought into question the company’s cell phone policy, because workers at the facility weren’t alerted to the tornado warning the National Weather Service sent out 30 minutes before the storm hit.
Unlike Apple, Inc AAPL, which has been flying in blue-skies over the past four trading days, Amazon has been trading in a long period of consolidation after printing a bearish double top pattern near its July 13 all-time high of $3,773.08 on Nov. 19.
See Also: Amazon Web Services Explains The Cause Of Dec. 7 Outage, Taking Steps To Avoid Similar Event
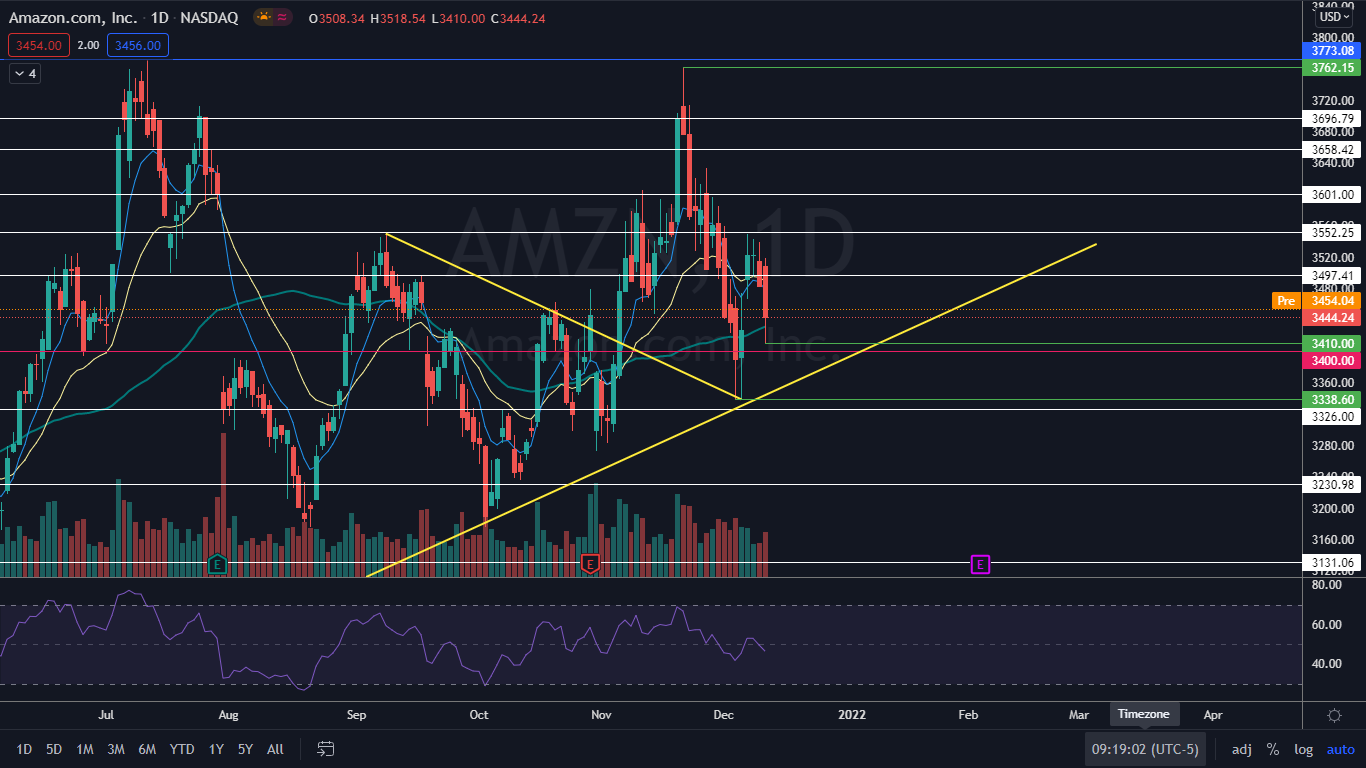
The Amazon Chart: After being unable to break to a new all-time high in November, Amazon fell 11% to the $3,338.60 level on Dec. 3 where it ran into a group of buyers who helped the stock bounce up from the area. On Dec. 6, Amazon retested the level as support and bounced again.
The two back-to-back wicks from the area created a bullish double tweezer bottom pattern and on Dec. 7, Amazon reacted to the pattern and gapped up. Since then, Amazon has consolidated the move by trading slightly lower on lower-than-average volume.
On Friday, Amazon created a higher low at the $3,410 mark and printed a bullish hammer candlestick, which indicates higher prices may come on Monday. Traders will want to see if Amazon can now print a higher high above the Dec. 7 high of $3,552.25, which would confirm an uptrend is about to begin.
Amazon is trading below the eight-day and 21-day exponential moving averages (EMAs), with the eight-day EMA trending below the 21-day, both of which are bearish indicators. The stock is trading above the 50-day simple moving average, however, which indicates longer-term sentiment is bullish.
Want direct analysis? Find me in the BZ Pro lounge! Click here for a free trial.
- Bulls want to see big bullish volume come in and break Amazon up to make a higher high on the daily chart. There is resistance above at $3,497 and $3.552.
- Bears want to see big bearish volume come in and drop Amazon down below the $3,338 mark, which would confirm a lower high has been printed and the stock is trading in a downtrend. The stock has support at $3,500 and $3,230.
© 2024 Benzinga.com. Benzinga does not provide investment advice. All rights reserved.
Comments
Trade confidently with insights and alerts from analyst ratings, free reports and breaking news that affects the stocks you care about.

