Lucid Group, Inc LCID and Nio, Inc NIO have been popular stocks for retail traders this year as the rising demand for electric vehicles accelerates.
In 2020 and the beginning of 2021, smaller EV manufacturers often followed Tesla, Inc’s TSLA price swings by trading higher in unison or lower in sympathy.
Recently, individual EV stocks have begun to trade based, more so, on their own fundamentals and technical patterns, however. For example, Nio’s stock has been negatively affected by poor U.S./China relations whereas Lucid has been pushed higher as it nears the deliveries of its first model, the Lucid Air.
Both stocks have retraced from their all-time highs. While Lucid looks to be consolidating for another run higher, Nio’s stock has settled into a bearish pattern on the daily chart and if the pattern is recognized, could be headed for 52-week lows.
It should be noted that events such as the general markets turning bearish, negative reactions to earnings prints and negative news headlines about a stock can quickly invalidate bullish patterns and breakouts.
As the saying goes, the trend is your friend until it isn’t, and any trader in a bullish position should have a clear stop set in place and manage their risk versus reward.
See Also: A Christmas Wish List For EV Makers
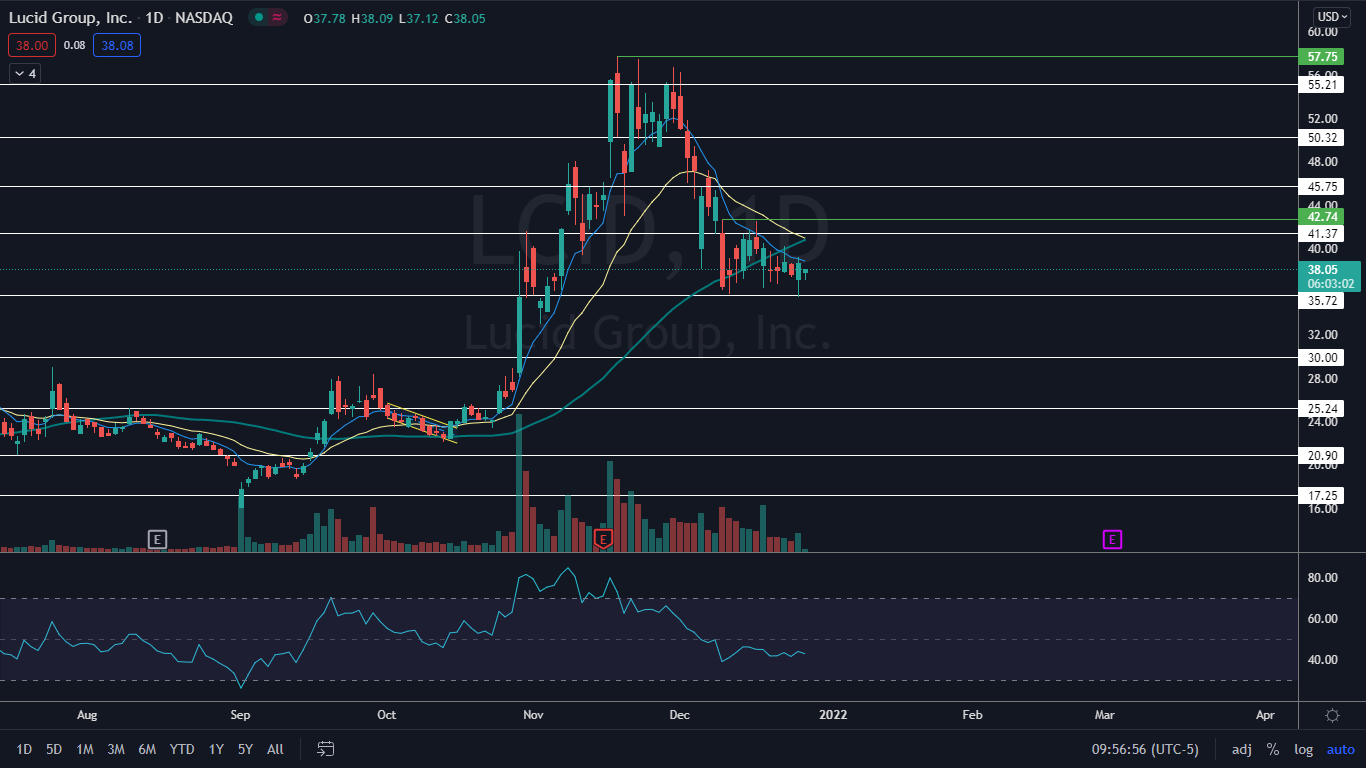
The Lucid Chart: Lucid reached a Nov. 17 high of $57.75 before retracing about 38% to $35.72 on Dec. 10 amid general market turmoil.
- Since that date, Lucid has been consolidating in a sideways pattern between a support level at $35.72 and $42.75.
- The Dec. 10 low paired with the price action on Monday where Lucid bounced from the same support level, has caused the stock to print a bullish double bottom pattern at the level. If the pattern is recognized, Lucid may trade up higher and break the sideways range over the coming trading days.
- Lucid has resistance above at $41.37 and $45.75 and support below at $35.72 and $30.
Want direct analysis? Find me in the BZ Pro lounge! Click here for a free trial.
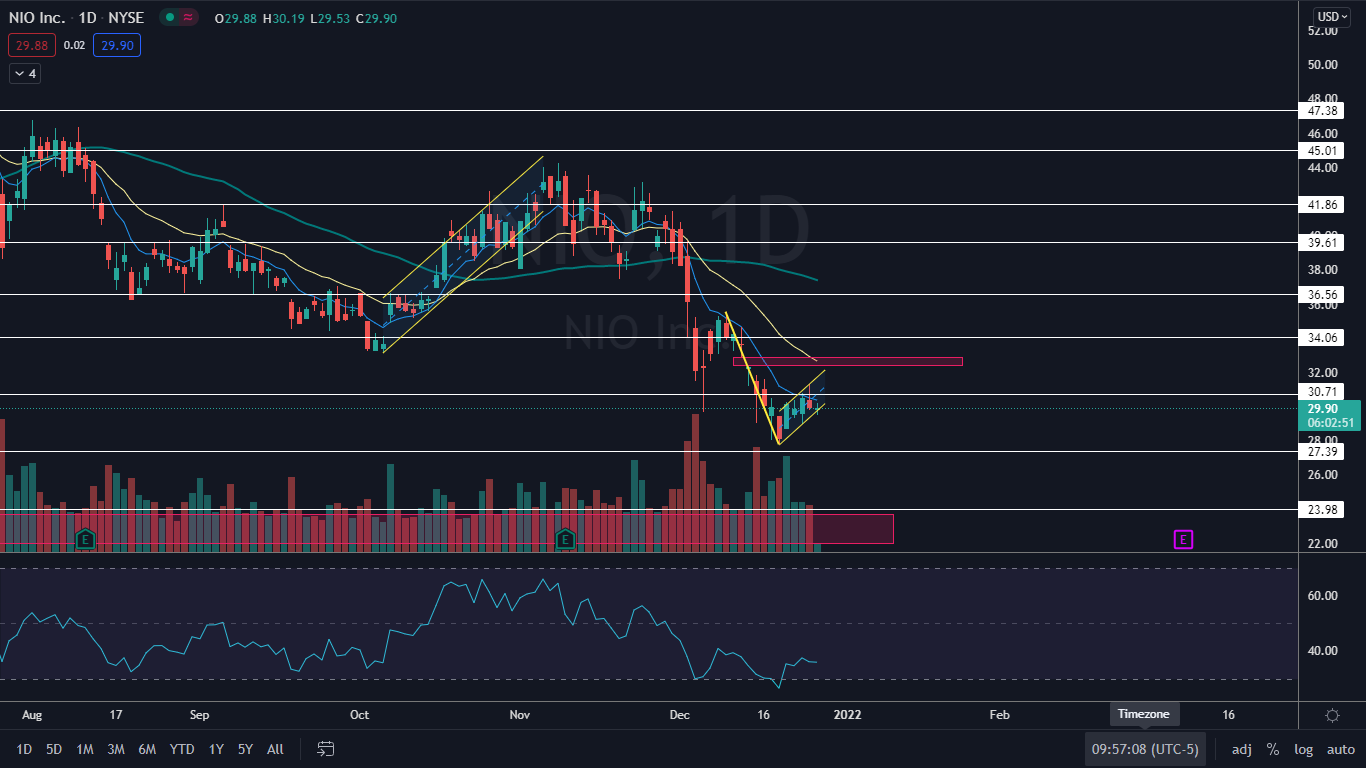
 The Nio Chart: Nio has retraced over 55% from its Jan. 11 high of $66.99 and since Nov. 8 has been trading in a fairly steep downtrend.
- Nio’s stock may be printing a bear flag pattern on the daily chart with the pole formed between Dec. 9 and Dec. 20 and the flag created since. If the pattern is recognized the measured move is about 22%, which indicates Nio could trade down toward the $22 level.
- If Nio dropped toward that level, it could fill a lower gap between $21.97 and $23.73 that was left behind on Oct. 14, 2020. Nio also has a small gap above that was created on Dec. 14 in the $32.38 and $32.90 range.
- Nio has resistance above at $30.71 and $34.06 and support below at $27.39 and $23.98.

Edge Rankings
Price Trend
© 2025 Benzinga.com. Benzinga does not provide investment advice. All rights reserved.
Trade confidently with insights and alerts from analyst ratings, free reports and breaking news that affects the stocks you care about.