Tesla, Inc TSLA is rallying Monday after the automaker reported record fourth-quarter and full-year deliveries that blew past analyst estimates.
The technology and electric vehicle company delivered 308,600 vehicles during the quarter, which represents a 28% increase over the third quarter and about a 71% increase from the same quarter the year prior. The Street consensus for the quarter came in at 266,000.
Analysts weighed in on Tesla’s delivery results, although the price targets can be wildly different: Wedbush analyst Daniel Ives maintained an Outperform rating and $1,400 price target on Tesla shares while JPMorgan analyst Ryan Brinkman raised the price target by 18% from $250 to $295.
Tesla’s reaction to the deliveries beat appears to, so far, favor more upside. Regardless of the news, the stock had settled into a pattern on the daily chart that looked ready to break bullishly.
See Also: Why This Analyst Thinks Tesla Is a $2,500 Stock And When It May Reach That Price Target
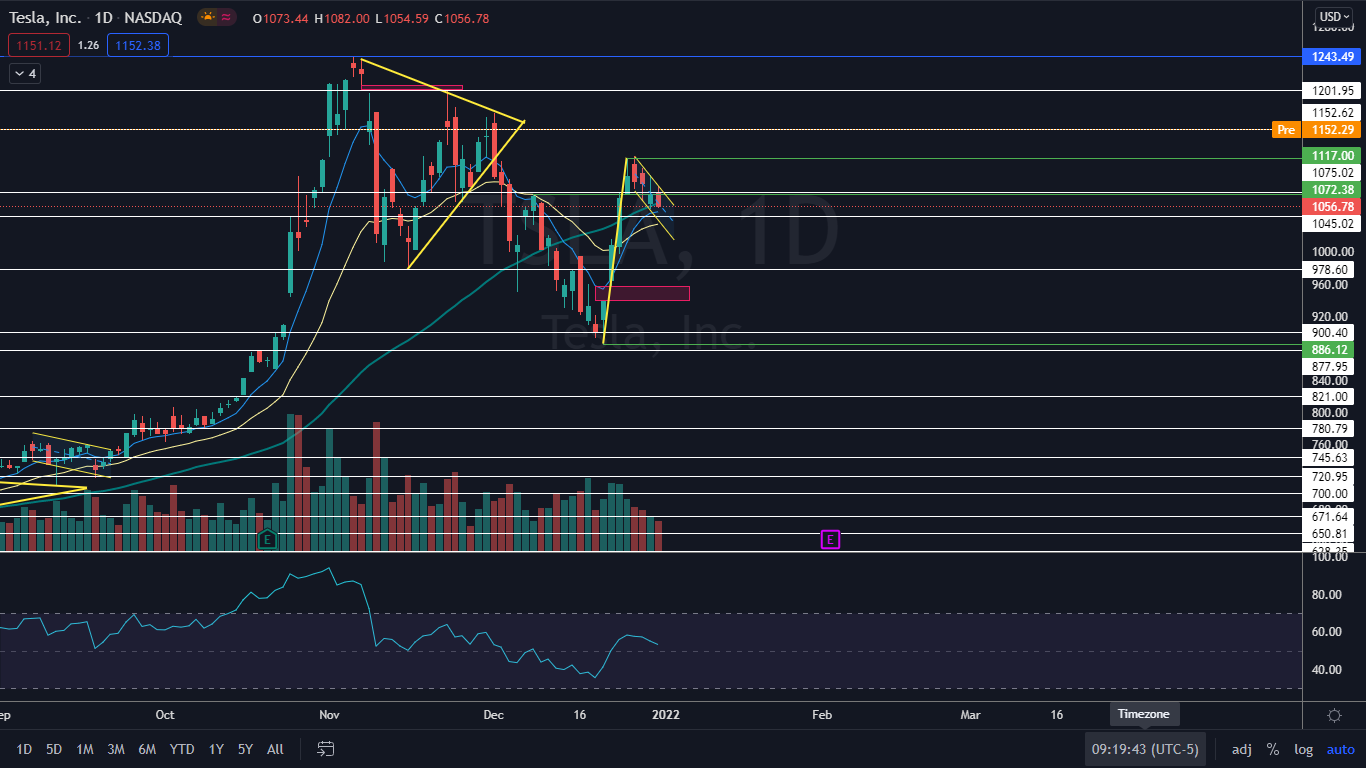
The Tesla Chart: Tesla shot up about $45 between Dec. 21 and Dec. 27 and then entered into a four-day period of consolidation, which Benzinga called out on Dec. 27. The rise higher paired with the consolidation settled Tesla into a bull flag pattern on the daily chart, which was perfectly set up into the news event over the New Year's weekend.
The measured move of the pattern, which is estimated by calculating the length of the pole and adding the number to the lowest price within the flag, is 26%. The number indicates Tesla could trade up toward the $1,300 range in the future.
Tesla has two gaps on its chart, which the stock is likely to trade into in the future because gaps on charts fill about 90% of the time. The first gap falls between the $1,201.95 and $1,208 range and the second gap is between $939.50 and $957.05. As of Monday morning, it looked as though Tesla was likely to fill the higher gap first, although traders will want to watch to see if the stock finds resistance at the top of the gap.
It should be noted Monday’s price action may create another lower gap down to about the $1,082 mark, which may concern bullish traders not already in a position. Traders who swung Tesla over the weekend will want to watch how the stock reacts to the gap.
Tesla is trading above the eight-day and 21-day exponential moving averages (EMAs), with the eight-day EMA trending above the 21-day, both of which are bullish indicators. The stock is also trading above the 50-day simple moving average (SMA), which indicates longer-term sentiment is bullish. The 50-day SMA has been acting as a solid level support over the past two trading days.
Want direct analysis? Find me in the BZ Pro lounge! Click here for a free trial.
- Bulls want to see big bullish volume come in and push Tesla up a resistance level near $1,152, which could indicate the gap up open on Monday is a breakaway gap and the stock will trade higher before potentially filling it. There is resistance at $1,075.02 and above $1,152 at $1,201. Above the areas, there is no futher resistance until the previous all-time high.
- Bears want to see big bearish volume come in and immediately force Tesla down into the gap and back down into the flag formation, which would indicate a bull trap had taken place. The stock has support below at $1,045.02 and $978.60.

© 2025 Benzinga.com. Benzinga does not provide investment advice. All rights reserved.
Trade confidently with insights and alerts from analyst ratings, free reports and breaking news that affects the stocks you care about.