Alibaba Group Holdings, Ltd BABA and Baidu, Inc BIDU were trading opposite to the general markets on Wednesday, rising over 5% and 1% at one point, respectively, while the SPDR S&P 500 continued to consolidate sideways by printing an inside bar on the daily chart.
Both stocks have tumbled significantly over the past many months, with Alibaba plummeting over 60% from its Oct. 27, 2020 all-time high of $319.32 and Baidu plunging about 58% from its all-time high of $354.82 that it printed on Feb. 22, 2021.
China-based stocks have been in turmoil due to Chinese regulatory crackdowns and poor Sino-American relations.
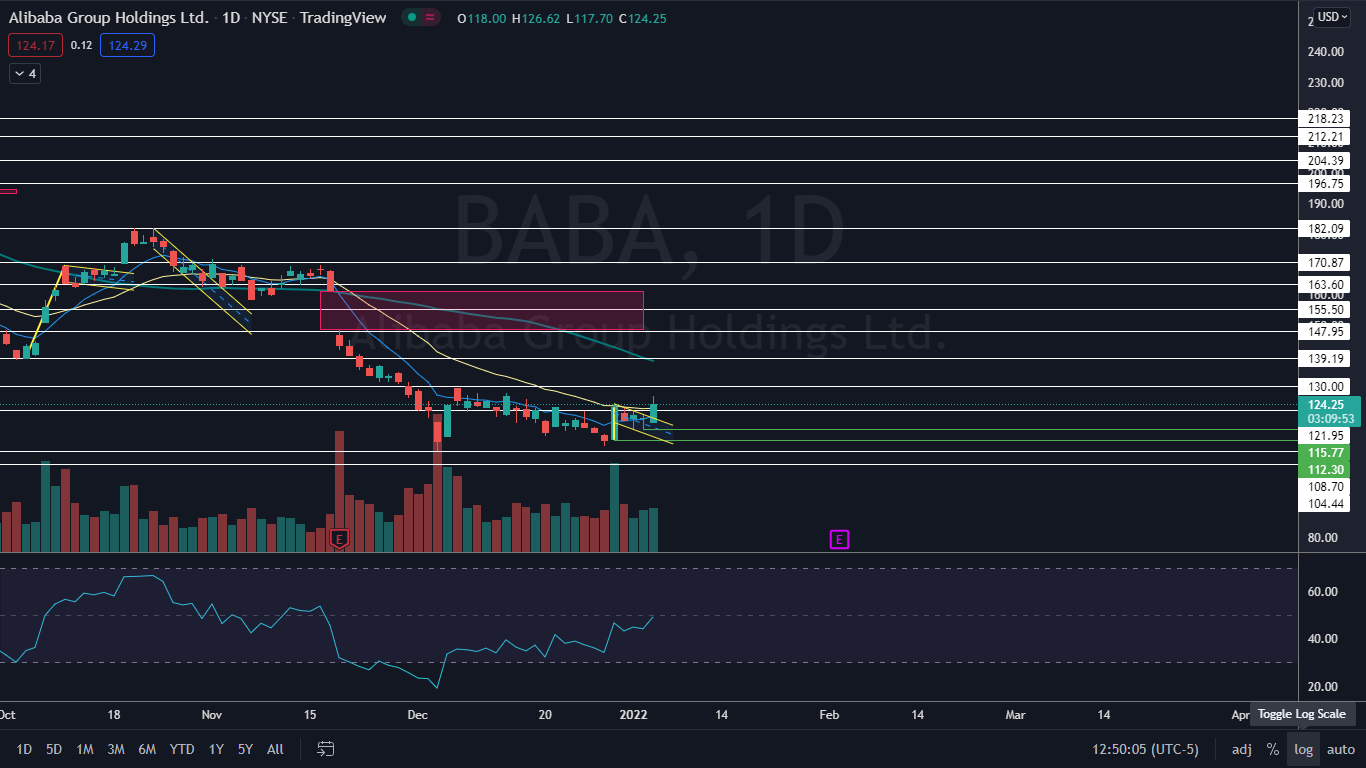
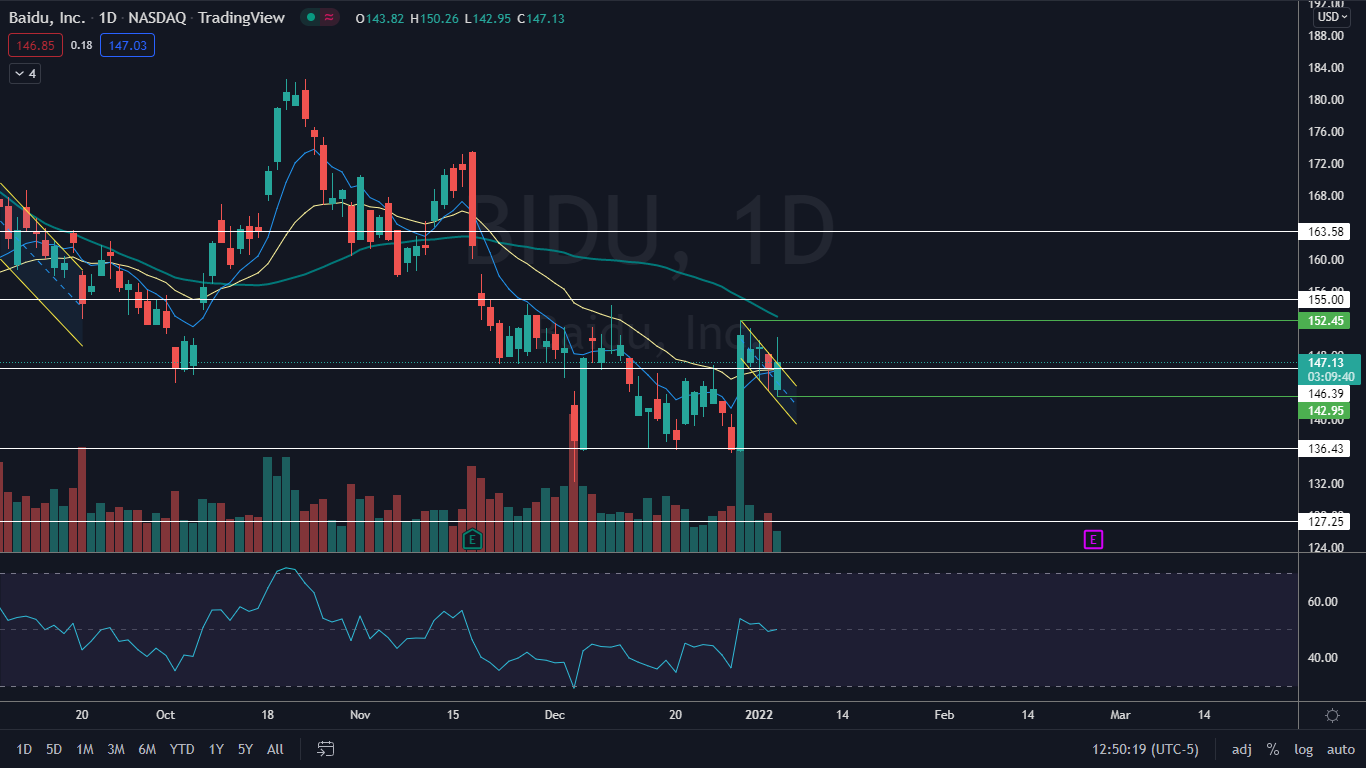
On Dec. 30, Alibaba and Baidu hit a bottom at the $112.30 and $136.43 levels, respectively, and bounced up from the area before entering into a three-day period of consolidation. The bounce up from the levels, paired with the consolidation, settled Alibaba and Baidu into bull flag patterns on the daily chart.
On Wednesday, the stocks were reacting bullishly to the formation, although Alibaba confirmed the pattern by breaking up from it while Baidu attempted to react to the bull flag but dropped back down into it.
Baidu may need a longer period of consolidation before the bull flag is recognized.
The bull flag patterns may mark the bottom for Alibaba and Baidu and a bullish 2022 may be in the cards if the stocks can continue in their uptrends.
It should be noted that events such the general markets turning bearish, negative reactions to earnings prints and negative news headlines about a stock can quickly invalidate bullish patterns and breakouts. As the saying goes, the trend is your friend until it isn’t, and any trader in a bullish position should have a clear stop set in place and manage their risk versus reward.
See Also: Read Why China Penalized Alibaba, Tencent, Bilibili
In The News: On Tuesday, a 13F filing was released showing the Charlie Munger-run Daily Journal doubled its stake in Alibaba during the fourth quarter from the 302,060 shares it held at the end of the third quarter to 602,060 shares.
News of the hedge fund buying Alibaba, which indicates a bullish sentiment change in China-based stocks, likely spilled over into Baidu, as retail traders and investors sometimes follow “smart money.”
The Chinese government also began relaxing its stance and vowed to focus on consumption recovery and reduce some income tax rates, which may help to ease the downward pressure on China-based companies.
The Alibaba Chart: Alibaba made a clear break up from the bull flag on Wednesday on higher-than-average volume, which indicates the pattern was recognized.
- As of about 12 p.m. EST, over 21 million shares had already exchanged hands compared to the total average 10-day volume of 22.33 million shares.
- On Monday and Tuesday, Alibaba printed a higher low at the $115.77 level, which indicated the stock had reversed course into an uptrend. Wednesday’s price action created a higher high within the trend. Alibaba must hold above the $115 level to print its next higher low.
- Alibaba has resistance above at $130 and $139.19 and support below at $108.70 and $104.44.

Want direct analysis? Find me in the BZ Pro lounge! Click here for a free trial.
The Baidu Chart: On Wednesday, Baidu was attempting to break up from its daily bull flag pattern but struggling due to a lack of volume.
- In comparison to Alibaba, which looked set to trade far above its daily average volume by the end of the trading session, only about 1.5 million Baidu shares had exchanged hands by early afternoon compared to the 10-day average of 3.28 million.
- Like Alibaba, Baidu is trading in an uptrend. On Wednesday, the stock printed a higher low at the $142.95 level but it has not yet printed a higher high. In order to print a higher high, Baidu will have to pop up over the Dec. 30 high of $152.45.
- Baidu has resistance above at $155 and $163.58 and support below at $136.43 and $127.25.

The Tmall app. Photo courtesy of Alibaba.
Edge Rankings
Price Trend
© 2025 Benzinga.com. Benzinga does not provide investment advice. All rights reserved.
Trade confidently with insights and alerts from analyst ratings, free reports and breaking news that affects the stocks you care about.