
Walt Disney Co DIS and SeaWorld Entertainment, Inc SEAS were relatively flat to start Wednesday’s trading session. On Tuesday, both stocks printed bullish Marubozu candlesticks within an inside bar pattern after Disney and SeaWorld pulled back slightly on Monday.
Both stocks have settled into bullish patterns on their daily charts and look set to head higher over the coming days and possibly weeks. SeaWorld looks set to make an all-time high run, however, while Disney will have to battle many resistance levels before making it anywhere near its March 8 all-time high of $203.02.
It should be noted that events such the general markets turning bearish, negative reactions to earnings prints and negative news headlines about a stock can quickly invalidate bullish patterns and breakouts. As the saying goes, "the trend is your friend until it isn’t," and any trader in a bullish position should have a clear stop set in place and manage their risk versus reward.
See Also: Disney Debuts Trailer For 'The Bob's Burgers Movie'
In The News: In a memo to staff, Disney CEO Bob Chapek identified “storytelling excellence,” “innovation” and “relentless focus on our audience” as the three foundational goals for 2022. Unlike SeaWorld, which operates just three zoological and theme parks in the U.S. Disney has multiple business segments including its parks and resorts, cruise line, streaming service and studio entertainment operations.
Despite having a slimmer focus, SeaWorld has been a stronger stock than Disney, making new all-time high after new all-time high throughout 2021. Disney has lost about 22% of its value over the last 10 months.
SeaWorld is expanding its initiatives within its current business model, however, and on Jan. 10 announced the launch of its new Inside Look experience, which will give visitors a look at veterinary care and protection and preservation work that goes on behind-the-scenes. The program is available at all three SeaWorld location on select weekends in January and is included in the regular admission cost.
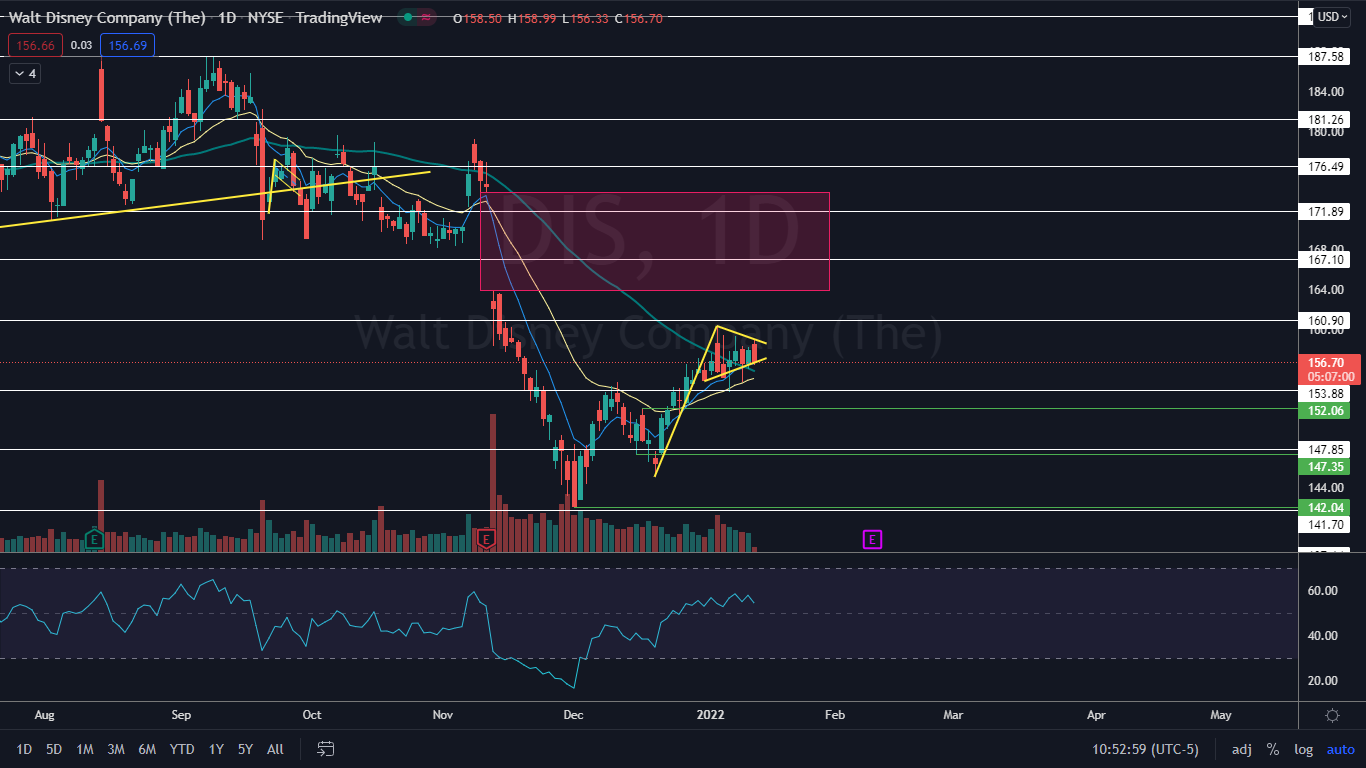
The Disney Chart: Disney reversed into an uptrend on Dec. 1 when the stock bounced up from the $142.04 level. Disney confirmed the trend change by printing a higher low and a higher high and then settled into a tightening pennant pattern on the daily chart.
- The most recent rise to a higher high paired with the pennant formation has created a bull flag pattern, with the pole formed between Dec. 20 and Jan. 4 and the flag continuing to print in the days since then.
- If the bull flag is recognized and Disney breaks up from the pattern on higher-than-average volume, the measured move is about 8%, which indicates Disney could trade up toward the $166 level.
- A gap exists on Disney’s chart between $163.87 and $173.87, and since gaps fill about 90% of the time, it is likely Disney will trade up to fill the range in the future.
- Disney has resistance above at $160.90 and $167.10 and support below at $153.88 and $147.85.
Want direct analysis? Find me in the BZ Pro lounge! Click here for a free trial.
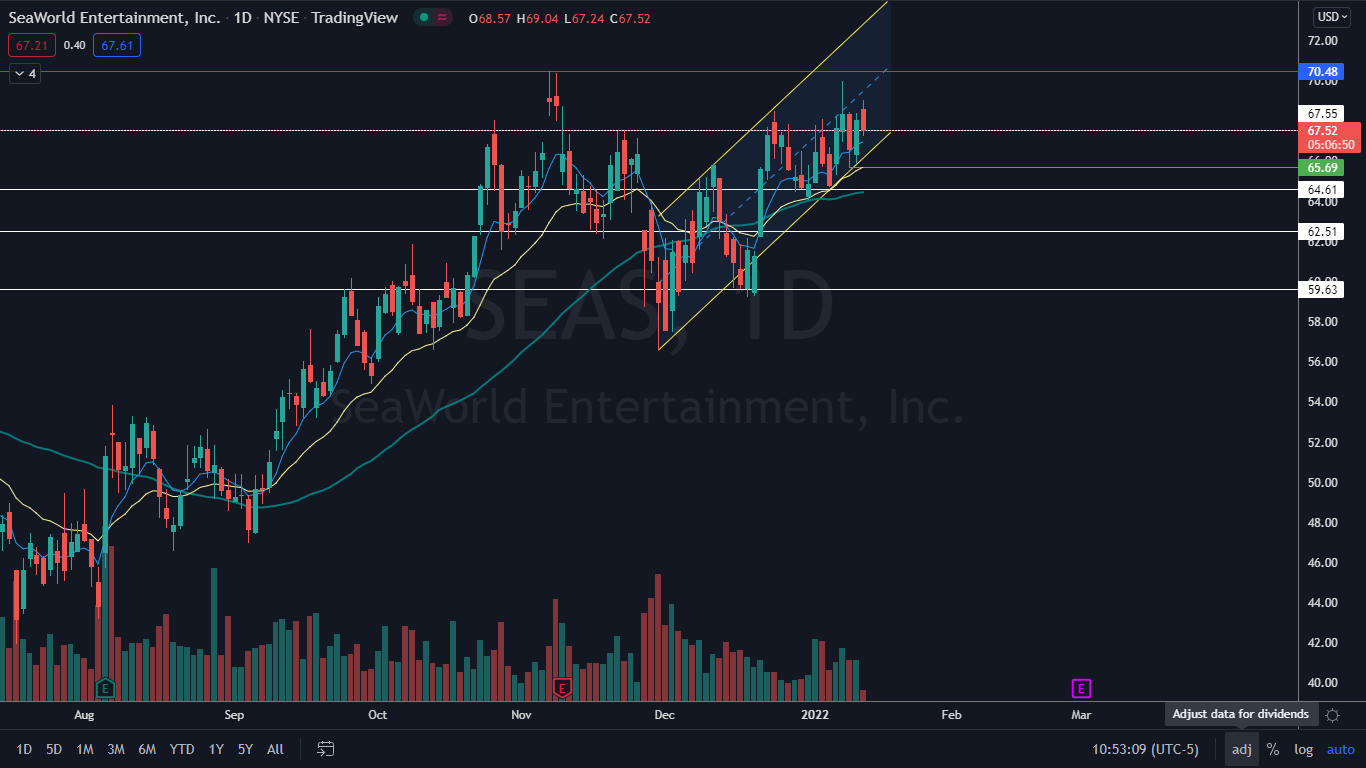
 The SeaWorld Chart: SeaWorld reached a new all-time high of $70.48 on Nov. 5 but then on Nov. 8 printed a bearish double top at the level, which sent the stock into a long period of consolidation.
- SeaWorld is trading in a confirmed uptrend within an ascending channel. The pattern is likely to continue to guide the stock higher and could take SeaWorld to a new all-time high on its next higher high.
- To continue in the uptrend, SeaWorld needs to hold above the most recent higher low printed on Jan. 10 at $65.69.
- SeaWorld has resistance above at $67.55 and the all-time high and support below at $64.61 and $62.51.
© 2025 Benzinga.com. Benzinga does not provide investment advice. All rights reserved.
Trade confidently with insights and alerts from analyst ratings, free reports and breaking news that affects the stocks you care about.

