Netflix, Inc NFLX is set to print its fourth-quarter earnings after the closing bell Thursday as big tech earnings kick off the start of the 2022 trading year.
When the streaming giant reported third-quarter results on Oct. 19, it posted revenue of $7.48 billion and earnings of $3.19 per share, which beat the Street consensus of $2.56 for the quarter. Netflix fell over 2% the following trading day but soared up about 10% over the seven trading days that followed.
During the third quarter, Netflix added 4.4 million net subscribers. The company guided for expectations of adding 8.5 million subscribers during the fourth quarter.
Deutsche Bank analyst Bryan Kraft lowered his estimate on new subscriptions to 7.25 million due to his analysis of Google trends data.
Holding a position of shares in a company over an earnings print is risky because stocks can fall on an earnings beat and rise following a miss. For options traders playing short-dated contracts, it is even riskier because the institutions selling the contracts increase the premiums to account for the potential volatility.
The market is pricing in about a 7.5% move and if Netflix doesn’t move more than that on Friday, many option traders will find their contracts expire worthless.
On Wednesday, Cathie Wood’s money managing firm Ark Investment Management de-risked its portfolio ahead of Netflix’s earnings print and sold 3,000 shares valued at approximately $1.5 million.
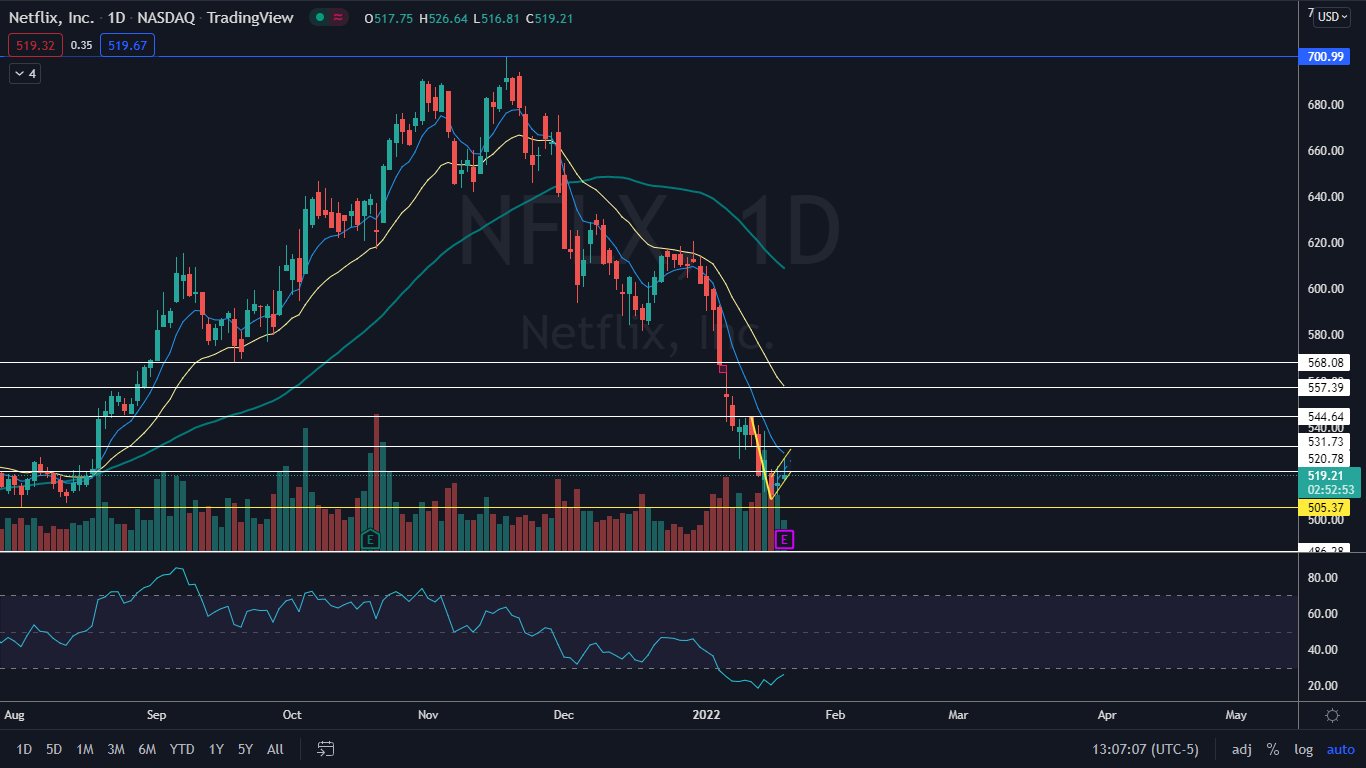
Netflix stock has been in freefall since reaching a Nov. 17 all-time high of $700.99 and has settled into a bearish pattern on the daily chart. Whether the pattern is recognized or negated will likely come down to how the market reacts Friday to its earnings print.
See Also: If You Invested $1,000 In Netflix Stock One Year Ago, Here's How Much You'd Have Now
The Netflix Chart: Netflix has fallen over 25% off its all-time high. On Thursday, the stock was continuing a two-day bounce to bring its relative strength index (RSI) up from oversold territory. Since Jan. 5, Netflix’s RSI measured in below the 30% level, which can be a buy signal for technical traders.
The most recent multiday fall between Jan. 12 and Tuesday, paired with a relief bounce to the upside, may have settled Netflix into a bear flag pattern on the daily chart. The measured move of the pattern is about 6.5%, which indicates that if the pattern is recognized Netflix could fall toward the $492 level.
There is a key support level on Netflix’s chart at $505 and if the stock closes a trading day below the area, a steep sell-off could occur. The area is key because Netflix has been trading above it since June 22 and has tested the level as support multiple times and bounced.
Netflix is trading below the eight-day and 21-day exponential moving averages (EMAs), with the eight-day EMA trending below the 21-day, both of which are bearish indicators. The stock is also trading below the 50-day simple moving average, which indicates longer-term sentiment is bearish.
Want direct analysis? Find me in the BZ Pro lounge! Click here for a free trial.
- Bulls want to see big bullish volume come in and push Netflix up above the eight-day EMA, which will negate the bear flag. Netflix has resistance above at $531.73 and $544.64.
- Bears want to see big bearish volume come in and drop the stock down from the flag formation and for momentum to push it down under the key level at $505. Below the area there is psychological support at $500 and price history support at $486.
 See Also: Truist Remains Bullish On Netflix; Sees Sharp Upside
Edge Rankings
Price Trend
© 2025 Benzinga.com. Benzinga does not provide investment advice. All rights reserved.
Trade confidently with insights and alerts from analyst ratings, free reports and breaking news that affects the stocks you care about.