Starbucks Corporation SBUX is muted ahead of its first-quarter 2022 earnings print, which is expected after the closing bell on Tuesday.
When the multi-national coffee house chain reported mixed fourth-quarter earnings on Oct. 28, 2021, the stock gapped down the following day and closed the session 6.3% lower.
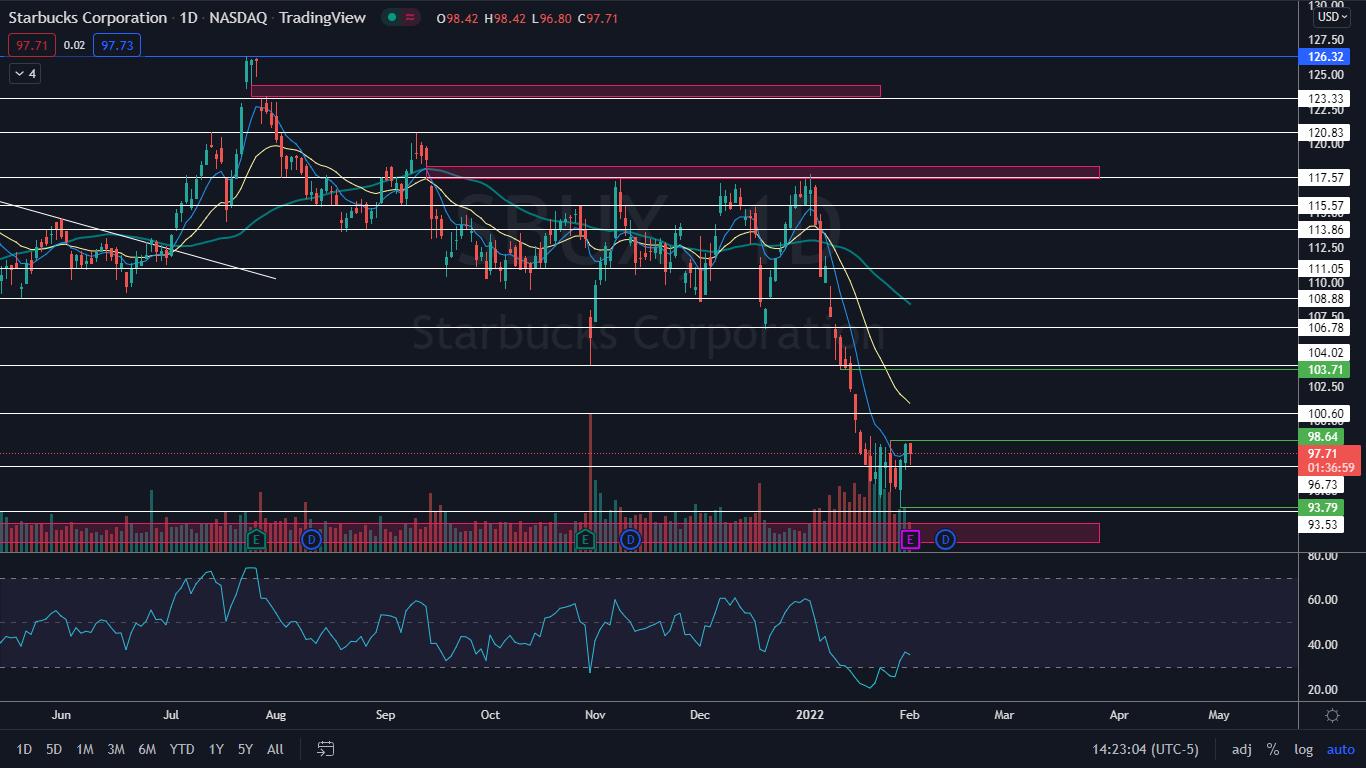
Following the bearish reaction to its earnings, Starbucks traded mostly sideways between about $104 and $117 until Jan. 13 when the stock fell through a key support level at $104.02. The loss of the level escalated into a further 10% slide that brought the stock down to a Jan. 28 low of $93.79.
Rising coffee prices have made investors increasingly wary that Starbucks’ margins will be negatively affected, Bank of America analyst Sara Senatore said in a note on Monday. Coffee prices are up about 90% higher than a year ago but Senatore said coffee sales only account for around 15% to 20% of the company’s revenues and that Starbucks has become more proficient at purchasing coffee, locking in prices in advance.
On Tuesday, Starbucks was trading on lower-than-average volume, which indicates there is a current lack of interest in the stock. Traders and investors may be waiting to see how Starbucks performs before entering into a position, which may be a wise move considering earnings reactions can be volatile and irrational.
See Also: If You Invested $1,000 In Starbucks Stock One Year Ago, Here's How Much You'd Have Now
The Starbucks Chart: On Monday, Starbucks attempted to print a higher high above the Jan. 26 high of $98.64 but failed, which indicates the stock is still in a technical downtrend. It’s possible the 4.92% move higher on Friday and Monday was just an oversold bounce because the stock’s relative strength index had dropped below the 30% level, which can be a short-term buy signal for traders.
Tuesday’s price action is slightly more bullish because it looks as though the stock will print an inside bar pattern on the daily chart. The inside bar pattern in this case would learn bullish because Starbucks was trading higher before forming the pattern.
Starbucks has two relatively close gaps on its chart, with the closest gap below the current share price between $91.20 and $92.66 and the second gap above between the $117.47 and $118.36 range. Gaps on charts fill about 90% of the time so it's likely Starbucks will trade into both ranges in the future.
Want direct analysis? Find me in the BZ Pro lounge! Click here for a free trial.
- Bulls want to see a bullish reaction to earnings and for big bullish volume to come in and push the stock up to print a higher high while keeping in mind a higher low will eventually be needed to confirm an uptrend. There is resistance above at $100.60 and $104.02.
- Bears want to see a bearish reaction to the earnings print drop Starbucks down below Friday’s low-of-day, which would confirm the downtrend is still intact. There is support below at $96.73 and $93.53.

© 2025 Benzinga.com. Benzinga does not provide investment advice. All rights reserved.
Comments
Trade confidently with insights and alerts from analyst ratings, free reports and breaking news that affects the stocks you care about.