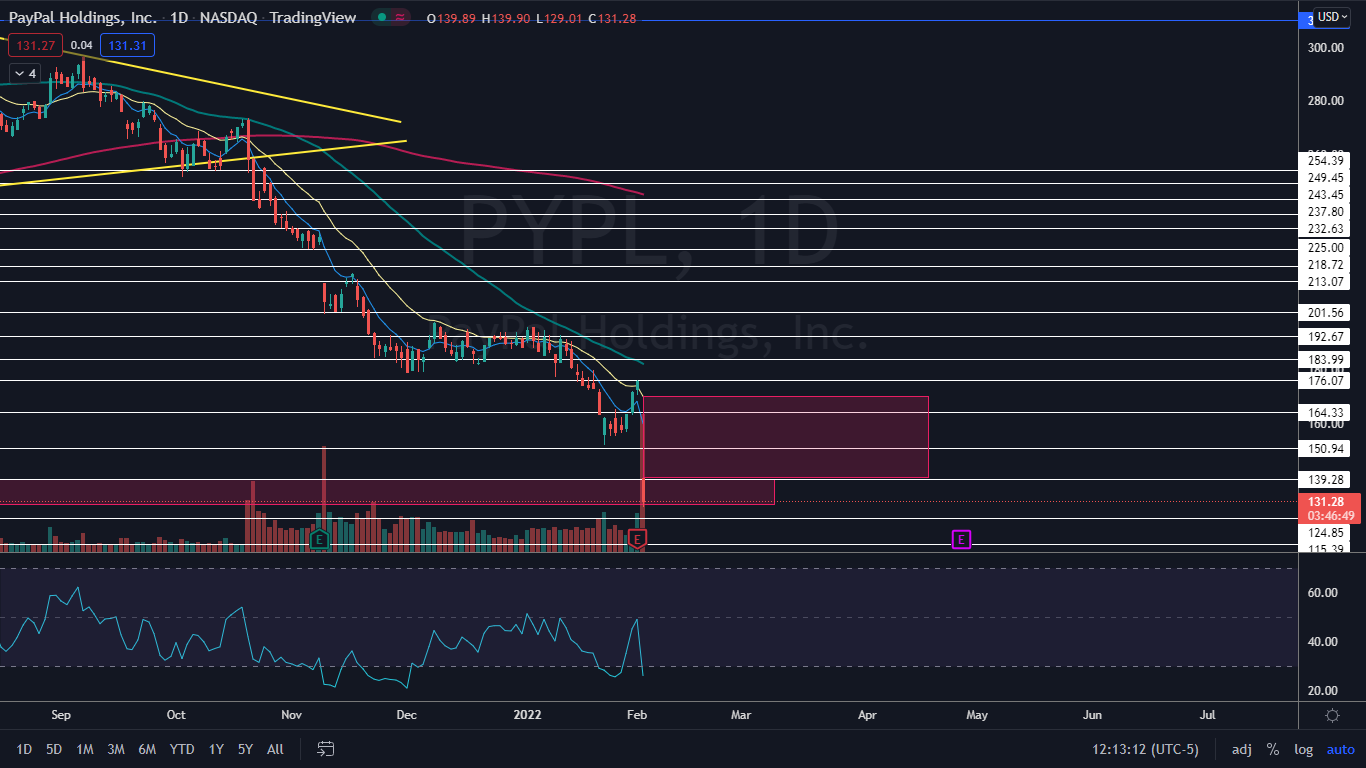
PayPal Holdings, Inc PYPL gapped down about 19% lower on Wednesday and fell another almost 6% intraday after the company announced mixed fourth-quarter earnings results on Tuesday after the markets closed.
The American multinational financial technology company reported quarterly earnings of $1.11 per share, which missed the analyst consensus estimate of $1.12. PayPal beat on revenues, however, and reported sales of $6.90 billion, which beat the $6.86 billion estimate.
The stock has been in a steep sell-off since reaching an all-time high on July 26 at the $310.16 mark, plunging almost 60% since that date to a low of $129.01. The recent bearish price action combined with worse-than-expected earnings results caused a number of analysts to downgrade the stock on Wednesday morning.
Keybanc maintained an Overweight rating on PayPal but lowered its price target to $200, Rosenblatt maintains a Buy rating on PayPal but lowered its price target to $216 and JP Morgan maintained its Overweight rating and lowered its price target to $190. Despite the bearish analyst reactions, the firms’ price targets would be a gift for the stock, which is currently trading 31% below even the lowest price target.
The stock is due for at least a short-term bounce in the near future, as it has once again entered into the oversold territory on the daily chart.
See Also: Why PayPal Shares Are Plunging Today
The PayPal Chart: When PayPal plummeted on Wednesday, its relative strength index (RSI) fell back below the 30% level, which can be a buy signal for technical traders. The last time PayPal’s RSI fell below the level was on Jan. 24 and the stock bounced up 15.18% over the six days that followed.
Wednesday's fall also allowed PayPal to close a lower gap between the $129.59 and $139.28 range, which was left behind on May 7, 2020. Gaps on charts fill about 90% of the time and because it was the most likely scenario, that PayPal would drop to the $129 level, bulls may feel more confident going forward now that it is closed.
PayPal was trading on extremely high volume on Wednesday, with over 70 million shares having exchanged hands by just midday, compared to the 10-day average of 15.95 million. Even though the high volume indicates a heightened level of trader and investor interest, it isn’t a good indicator of direction following a news-related event.
PayPal is trading below the eight-day and 21-day exponential moving averages (EMAs), with the eight-day EMA trending below the 21-day, both of which are bearish indicators. The stock is also trading well below the 50-day and 200-day simple moving averages, which indicates long-term sentiment is bearish.
Want direct analysis? Find me in the BZ Pro lounge! Click here for a free trial.
- Bulls want to see PayPal trade sideways in consolidation on low volume for a period of time, and then for big bullish volume to come in and push the stock up to fill the upper gap that was left behind on Wednesday. The stock has resistance above at $139.28 and $150.94.
- Bears want to see sustained big bearish volume drop the stock down below a key level of support at $124.85, which PayPal has not fallen below since May 5, 2020. Below the area, there is further support at $115.39 and $103.72.

© 2024 Benzinga.com. Benzinga does not provide investment advice. All rights reserved.
Trade confidently with insights and alerts from analyst ratings, free reports and breaking news that affects the stocks you care about.