


Meta Platforms, Inc FB gapped up 2.76% on Monday in tandem with Alphabet, Inc GOOG GOOGL, which gapped up over 10% higher after printing a fourth-quarter earnings beat after the closing bell on Tuesday.
Meta will print its earnings on Wednesday after the markets close. On CNBC, Kevin O’Leary said he’s a buyer ahead of the event and expects Meta's narrative to begin to shift this quarter toward a "curated metaverse."
Meta is expected to post an increase in revenues but a small decline in profit as it boosts spending on its Metaverse. Analysts estimate Meta will report revenues have risen to $32.6 billion for the fourth quarter, up 19.9% year-over-year and $10.9 billion profit, with would represent a 2% decline from the same period the year prior.
Analysts expect advertising revenues from Facebook and Instagram to account for about 98% of the total.
Meta’s chart is set to go either way because the stock is signaling both bearish and bullish indicators. Traders not already in a position may prefer to wait and see how the stock reaction on Thursday because earnings can create both volatile and irrational share price swings following the print.
See Also: Why Meta Platforms Looks Poised For A Rally On Earnings
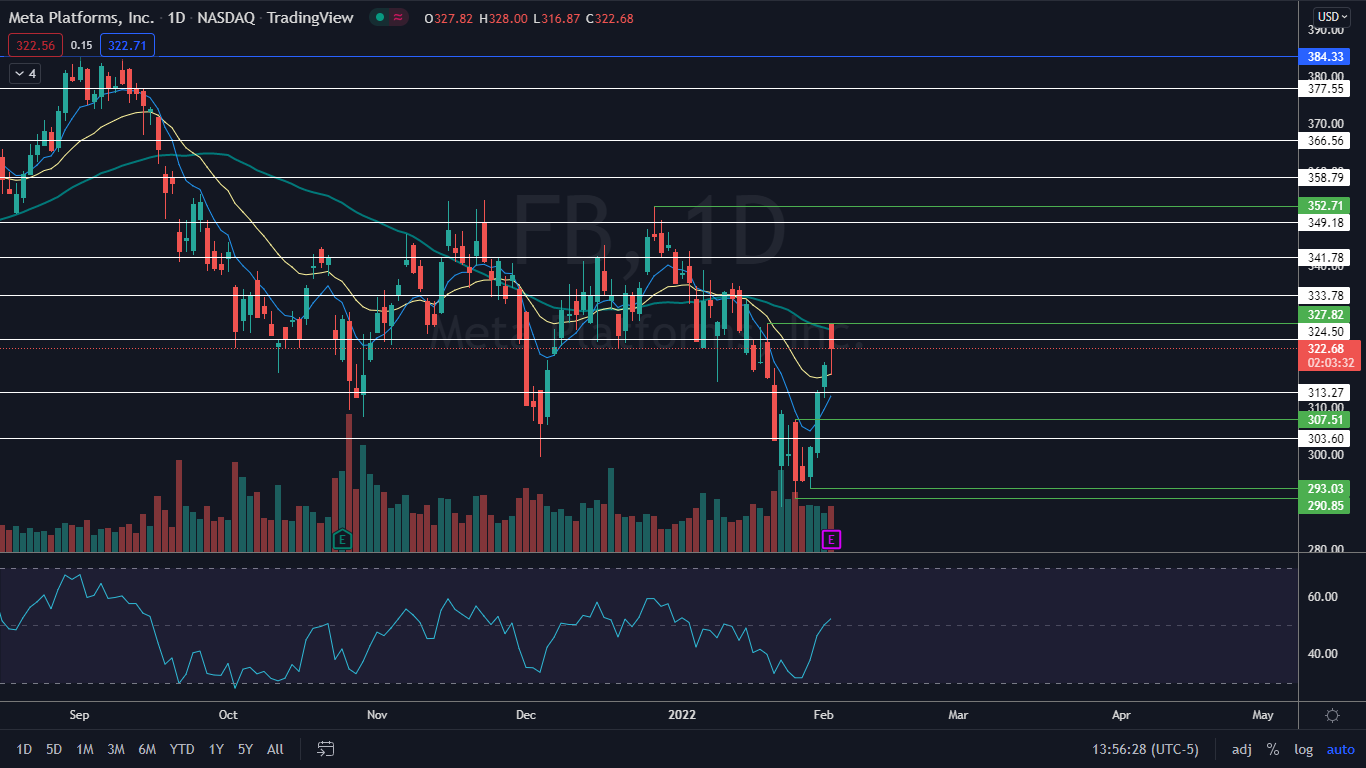
The Meta Chart: Meta is trading in a confirmed uptrend on the daily chart now that it has printed a higher low above the Jan. 26 low of $290.85 and a higher high above the Jan. 20 high of $327.82. The stock will eventually need to print another higher low to continue trading upwards within the pattern.
On the bear side, if Meta closes the trading day between about $324 and $328 it will print a bearish hanging man candlestick on the daily chart, which could indicate lower prices will come on Thursday. The candlestick is a lagging indicator, however, and won’t be able to be confirmed until further price action is seen.
On Tuesday, Meta regained the 21-day exponential moving average (EMA) after regaining the eight-day EMA on Monday, which is bullish. Bulls will want to see the stock continue to trade above the 21-day, which would eventually cause the eight-day to cross above the 21-day and would give bulls more confidence a longer-term run higher is in the cards.
Want direct analysis? Find me in the BZ Pro lounge! Click here for a free trial.
- Bulls want to see big bullish volume come in following the earnings print push Meta up above the 50-day simple moving average on the daily chart, which the stock was rejecting on Wednesday. There is resistance above at $324.50 and $333.78.
- Bears want to see big bearish volume come in and drop Meta down below the eight-day and 21-day EMAs and then for momentum to push the stock down 393.03, which would negate the uptrend. Meta has support below at $313.27 and $303.60.
Edge Rankings
Price Trend
© 2025 Benzinga.com. Benzinga does not provide investment advice. All rights reserved.
Trade confidently with insights and alerts from analyst ratings, free reports and breaking news that affects the stocks you care about.

