


PayPal Holdings, Inc PYPL was falling to a new 52-week low on Tuesday, dropping 1.75% to 119.28 by the afternoon. The move comes after the stock lost over 25% of its value on Feb. 1 due to a bearish reaction to its mixed fourth-quarter earnings print.
The stock has declined about 60% from its July 26, 2021 all-time high of $310.16 and is now trading at its lowest point since May 2020.
PayPal’s President and CEO Daniel H Schulman appears to believe the stock is trading at a discount and on Monday purchased $1 million worth of PayPal’s stock. The insider bought 7,994 shares at a price of $124.57. When PayPal dropped to its 52-week low on Tuesday, Schulman would have been down over $35,000 on his investment.
There are signs PayPal may reverse course to the upside in the near-term, however, whether the upside is merely a bounce or a reversal into a long-term uptrend will take some time to be determined.
See Also: Why Is Long-Time-Backer Peter Thiel Departing Facebook-Parent Meta's Board?
The PayPal Chart: PayPal may be forming a falling channel on the daily chart. A falling channel is considered to be bearish because the stock is likely to continue to make lower highs and lower lows within the pattern. When a stock breaks bullishly through the upper descending trendline of the pattern, however, it can be a strong reversal signal and combined with other indicators, PayPal may breach the pattern over the coming days.
PayPal’s relative strength index (RSI) is measuring in at about 24%. When a stock’s RSI reaches or falls below the 30% level, it becomes oversold, which can be a buy signal for technical traders. When PayPal’s RSI fell to the 26% level on Jan. 26, the stock shot up over 13% over the five trading days that followed.
On Tuesday, PayPal looked to be printing an inverted hammer candlestick. When an inverted hammer candlestick is found at the bottom of a downtrend it can signal a reversal to the upside is in the cards, although it is a lagging indicator, which means Wednesday’s candle will be needed for confirmation.
PayPal has two gaps above on its chart, with the first appearing between $139.90 and $170.53 and the second between the $215.97 and $226.25 range. Gaps on charts fill about 90% of the time, which makes it likely PayPal will eventually trade up to fill both ranges.
PayPal is trading below the eight-day and 21-day exponential moving averages (EMAs), with the eight-day EMA trending below the 21-day, both of which are bearish indicators. The stock is also trading below the 50-day simple moving average, which indicates longer-term sentiment is bearish.
Want direct analysis? Find me in the BZ Pro lounge! Click here for a free trial.
- Bulls want to see big bullish volume come in on Wednesday to bring the stock price higher and confirm the inverted hammer candlestick. There is resistance above at $124.85 and $139.28.
- Bears want to see big bearish volume come in and drop PayPal down below a support level at $115.39. Below the area, there is further support at $103.72 and the important psychological level of $100.
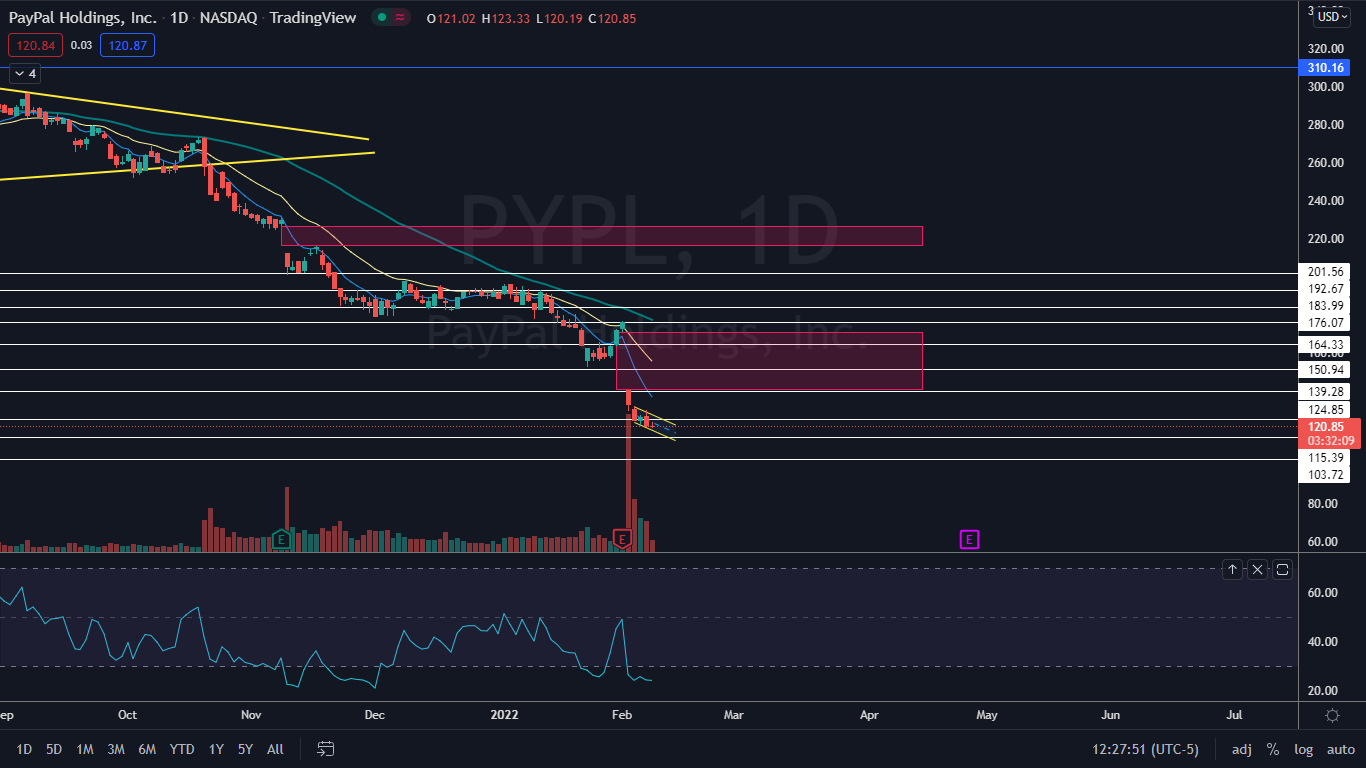
Photo: Courtesy of Diverse Stock Photos on Flickr
Edge Rankings
Price Trend
© 2025 Benzinga.com. Benzinga does not provide investment advice. All rights reserved.
Trade confidently with insights and alerts from analyst ratings, free reports and breaking news that affects the stocks you care about.

