
Zinger Key Points
- The stock has tested the $25.81 mark as support on four separate occasions.
On Monday evening, Benzinga asked its followers on Twitter what they’re buying at the open on Tuesday. From the replies, Benzinga selected one ticker for technical analysis.
@JeffreyAWillia4 and @CappyTrades are buying Lucid Group, Inc LCID.
The electric vehicle manufacturer is expected to print its fourth-quarter financial results on Feb. 28 and traders and investors will be focused on its delivery reservation and delivery numbers for the December quarter.
Ahead of the earnings print, Morgan Stanley analyst Adam Jonas said Lucid may underperform on its delivery numbers compared to expectations but doesn’t believe the miss will weigh on the stock. The analyst has an Underweight rating and a price target of $16 on the high-end EV maker.
When Lucid printed its third-quarter results on Nov. 15, the stock gapped up 11.95% the following day and rallied an additional 15.75% over the two trading days that followed to reach a Nov. 17 high of $57.75. The stock was trading in a strong uptrend going into its third-quarter print, however, compared to the fourth quarter, where Lucid has been trading sideways between about $25 and $30 since Jan. 28.
See Also: 30 Stocks Moving in Tuesday’s Pre-Market Session
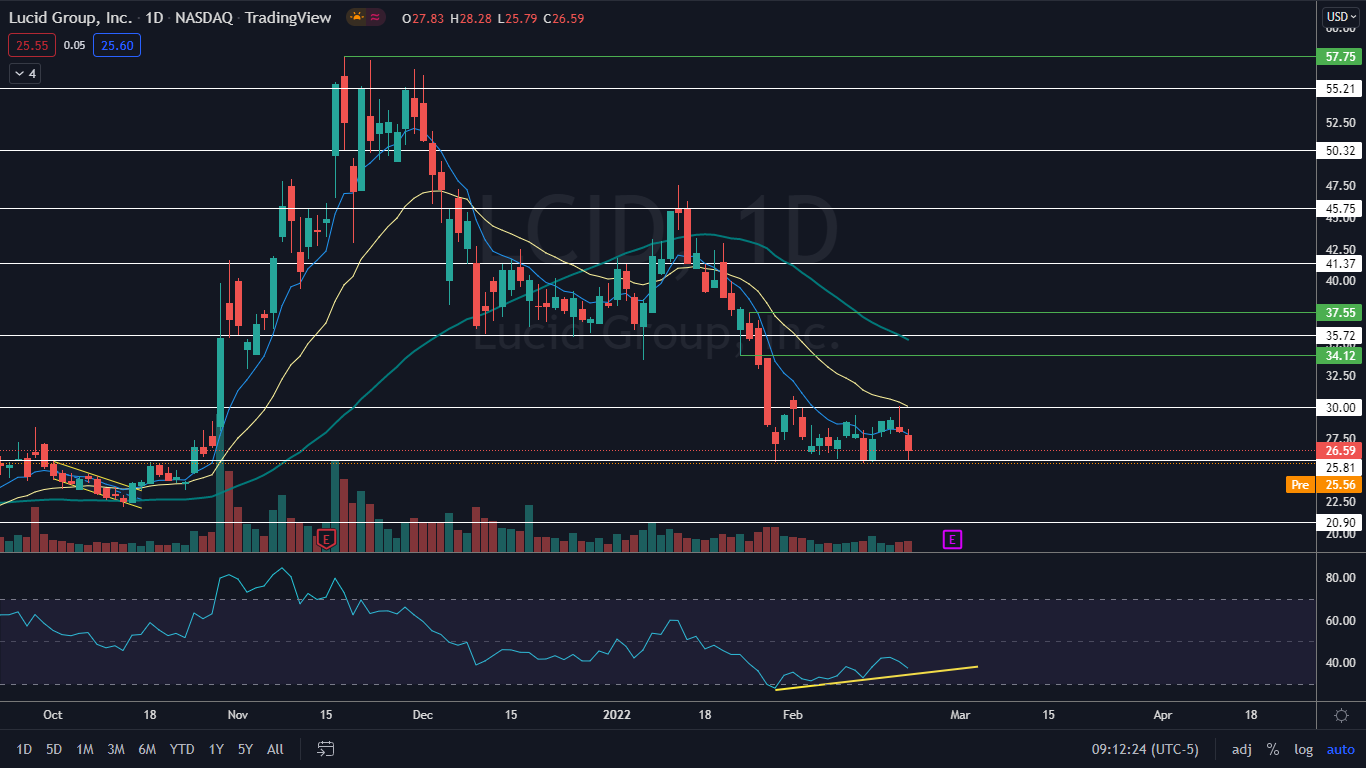
The Lucid Chart: Lucid is trading down about 54% from its third-quarter induced high but may have begun to show signs the bottom may be in. The stock has tested the $25.81 mark as support on four separate occasions, including on Friday, and held above the level, which has created a bullish quadruple bottom pattern on the daily chart.
Lucid’s relative strength index (RSI) has been hovering between about 29% and 42% since Jan. 28, which indicates the stock is near to being oversold. Lucid’s RSI has been rising up slightly, however, while the stock price has remained relatively flat, which has caused the stock to develop exaggerated bullish divergence. For the divergence to correct, it is likely Lucid will trade higher over the coming days.
On Friday, Lucid printed a hammer candlestick when it wicked from near the $25 level, which also indicates higher prices may come on Monday. When Lucid printed its last hammer candlestick on the daily chart the stock rose up over 10% during the following two trading days.
Lucid is trading below the eight-day and 21-day exponential moving averages (EMAs), with the eight-day EMA trending below the 21-day, both of which are bearish indicators. The stock is also trading well below the 50-day simple moving average, which indicates longer-term sentiment is bearish.
Want direct analysis? Find me in the BZ Pro lounge! Click here for a free trial.
- Bulls want to see big bullish volume come in and push Lucid up above the eight-day EMA and then for momentum to drive the stock up over the 21-day, which would also help Lucid to clear a resistance level at $30. Above that level there is further resistance at $35.72 and $41.37.
- Bears want to see big bearish volume come in and drop Lucid down below the $25 mark, which would indicate a downtrend is beginning. Below the level, there is support at $20.90 and $17.25.
© 2025 Benzinga.com. Benzinga does not provide investment advice. All rights reserved.
Trade confidently with insights and alerts from analyst ratings, free reports and breaking news that affects the stocks you care about.

