
Zinger Key Points
- Last Friday, the stock fell about 7.5% lower off Thursday’s close, which caused Palantir to print a bearish Marubozu candlestick.
- Palantir is likely to at least bounce over the coming days because its relative strength index is measuring in at about 29%.
- Every week, our Whisper Index uncovers five overlooked stocks with big breakout potential. Get the latest picks today before they gain traction.
Palantir Technologies, Inc PLTR was trading down over 5% on Tuesday, heading dangerously close to the stock’s all-time low of $8.92 printed in early October 2020.
The packaged software and big analytics company has secured hundreds of millions worth of contracts over the past year, but the stock has been pummeled, falling over 76% from the Jan. 27, 2021 all-time high of $45.
On Tuesday, Palantir announced a partnership with the Centers for Disease Control and Prevention (CDC) to power the digital operating system the CDC will use to assist the government with its COVID-19 vaccines, pediatric vaccines and therapeutics. The contract is worth $5.3 million for a duration of six months.
Regardless of the continued high-profile contracts, Palantir printed an earnings miss on Feb. 17 for the fourth quarter, which led to Deutsche Bank lowering its price target on the stock from $18 to $15.
Cathie Wood-led Ark Investment Management dumped a massive amount of shares following Palantir’s earnings results. On Feb. 18 the fund sold off 13.5 million shares of the company, estimated to be worth about $148.9 million.
See Also: Are Crime-Fighting Robots Coming to a Park Near You?
The Palantir Chart: On Feb. 17, Palantir broke down bearishly from an ascending triangle pattern on the daily chart on higher-than-average volume, which indicated lower prices were likely to come. On Friday, the stock fell about 7.5% lower off Thursday’s close, which caused Palantir to print a bearish Marubozu candlestick, which indicated lower prices were likely to come again on Tuesday.
Palantir is likely to at least bounce over the coming days because its relative strength index (RSI) is measuring in at about 29%. When a stock’s RSI reaches or falls below the 30% level it becomes oversold, which can be a buy signal for technical traders, although it should be noted RSI levels can remain extended for long periods of time.
The stock has a number of gaps above on its chart and because gaps fill about 90% of the time, it is likely Palantir will trade up into the empty ranges in the future. The first gap falls between $23.64 and $23.95 and if the stock forms a powerful reversal and trades up to fill the gap it will represent a 130% increase from the current share price.
Palantir is trading below the eight-day and 21-day exponential moving averages (EMAs), with the eight-day EMA trending below the 21-day, both of which are bearish indicators. The stock is also trading below the 50-day simple moving average, which indicates longer-term sentiment is bearish.
Want direct analysis? Find me in the BZ Pro lounge! Click here for a free trial.
- Bulls want to see Palantir form a reversal candlestick, such as a doji or hammer, which could indicate a bounce to the upside is on the horizon. There is resistance above at $10.99 and $13.18.
- Bears want to see sustained big bearish volume break the stock down to a new all-time low, which would give the bears more power because there is now support below the area. Before reaching an all-time low, Palantir has support at $9.79 and $8.92.
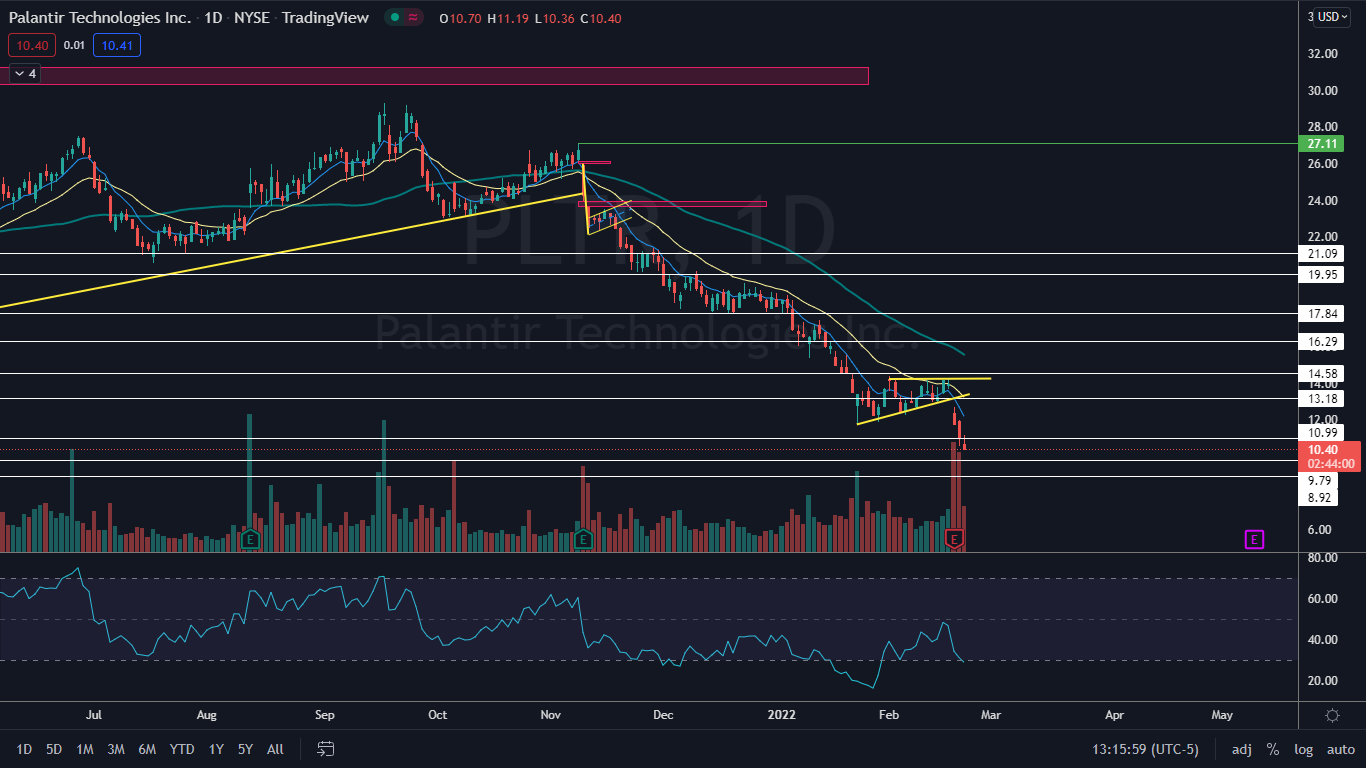
Photo: Courtesy of Cory Doctorow on Flickr
© 2025 Benzinga.com. Benzinga does not provide investment advice. All rights reserved.
Trade confidently with insights and alerts from analyst ratings, free reports and breaking news that affects the stocks you care about.

