Zinger Key Points
- Crude oil prices may continue to surge until the market can digest the extent of the economic consequences of this war.
- Between Dec. 31 and Feb. 7, Exxon soared almost 37% higher to reach a 52-week high of $83.08. Since then, Exxon has been consolidating slightly lower
- Feel unsure about the market’s next move? Copy trade alerts from Matt Maley—a Wall Street veteran who consistently finds profits in volatile markets. Claim your 7-day free trial now.
Exxon Mobil Corporation XOM gapped up almost 3% higher on Thursday morning but immediately ran into a group of sellers, which dropped the stock down 1.6% at press time.
Brent crude oil prices jumped 8.99% to over $105 a barrel at 5 a.m. EST, after Russian troops began a full-scale invasion of Ukraine overnight.
Russia’s aggression against its neighbor will be met with harsh sanctions from the west and because Russia is a top oil producer the sanctions are likely to stiffen the global energy supply. The rise in crude prices will also affect domestic prices and contribute further to the global rising inflation crisis.
Crude oil prices may continue to surge until the market can digest the extent of the economic consequences of this war. If that happens, Exxon Mobil is likely to follow but first, the stock needs to complete its consolidation pattern.
See Also: Exxon Mobil Outperforming Apple? How Energy Sector Volatility Is A 2-Way Street
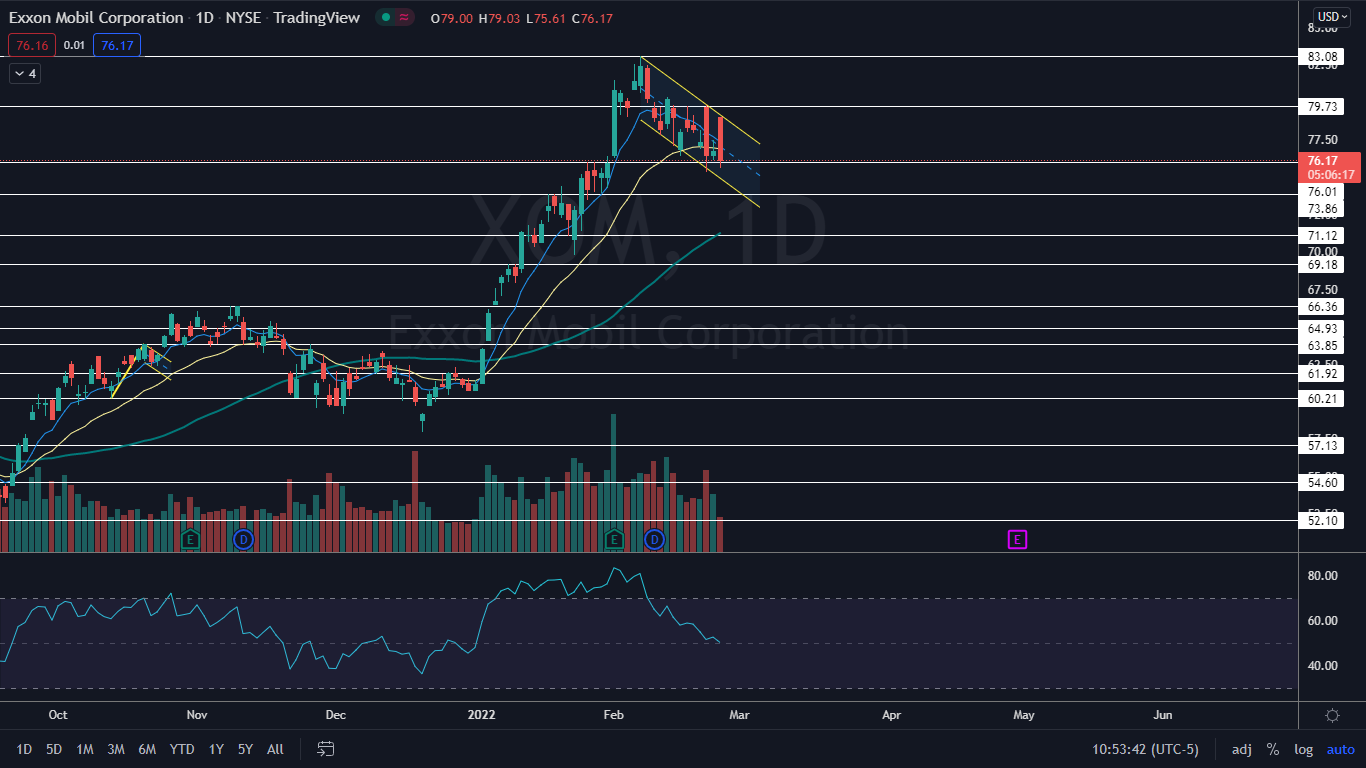
The Exxon Chart: Between Dec. 31 and Feb. 7, Exxon soared almost 37% higher to reach a 52-week high of $83.08. Since then, Exxon has been consolidating slightly lower between about the $75 and $80 level.
The rise higher paired with the consolidation has settled Exxon into a bull flag pattern on the weekly chart. The stock may also be trading in a bull flag pattern on the daily chart, although the pattern would have more validity in that timeframe if Exxon was holding above the eight-day exponential moving average. On either timeframe, traders can watch for a break up from the flag formation on higher-than-average volume to indicate that the pattern was recognized.
If Exxon continues to trade lower within the flag, the pattern may turn into a falling channel on the daily chart. Just as with a flag, traders can watch for a break up from the upper descending trendline of the channel on higher-than-average volume to take a position. When a stock breaks up bullishly from a falling channel it is a strong reversal signal.
The consolidation into the flag or falling channel pattern was needed to cool Exxon’s relative strength index (RSI), which hit a high of 83% on Feb. 1. When a stock’s RSI reaches or exceeds the 70% level it becomes overbought, which can be a sell signal for technical traders. Exxon’s RSI has now cooled down to a much more comfortable 50%.
Want direct analysis? Find me in the BZ Pro lounge! Click here for a free trial.
- Bulls want to see big bullish volume come in and break Exxon up from the flag or channel pattern and then for continued momentum to push the stock up to make a new 52-week high. The stock has resistance above at $79.73 and $83.08.
- Bears want to see big bearish volume come in and drop down through the bottom of the pattern to negate it, which will also set the stock into a downtrend. The stock has support below at 76.01 and $73.86.

Edge Rankings
Price Trend
© 2025 Benzinga.com. Benzinga does not provide investment advice. All rights reserved.
Trade confidently with insights and alerts from analyst ratings, free reports and breaking news that affects the stocks you care about.