
Zinger Key Points
- Shares of the automaker soared about 193% between January 2021 and Jan. 13, 2022, when Ford hit a 52-week high of $25.87.
- Get 5 stock picks identified before their biggest breakouts, identified by the same system that spotted Insmed, Sprouts, and Uber before their 20%+ gains.
Ford Motor Co F was down more than 5% Tuesday morning
Ford revealed its home charging station for its soon-to-launch F-150 Lightning will cost consumers $1,310. The legacy automaker will begin deliveries of its electric pick-up truck this spring and as of early December, had received about 200,000 bookings.
Despite the popularity of its new electric models, Ford has had to navigate through the economic and political events that have plagued the global community over the past two years, including supply chain issues caused by the COVID-19 pandemic and more recently, the Russian invasion of Ukraine.
On Feb. 25, Ford announced it would idle production of its F-150 at its Kansas City assembly plant due to the global semiconductor shortage. The difficulty in obtaining semiconductors, which are needed for multiple EV features including batteries and touch screens, is expected to become worse as the sanctions imposed on Russia begin to take effect.
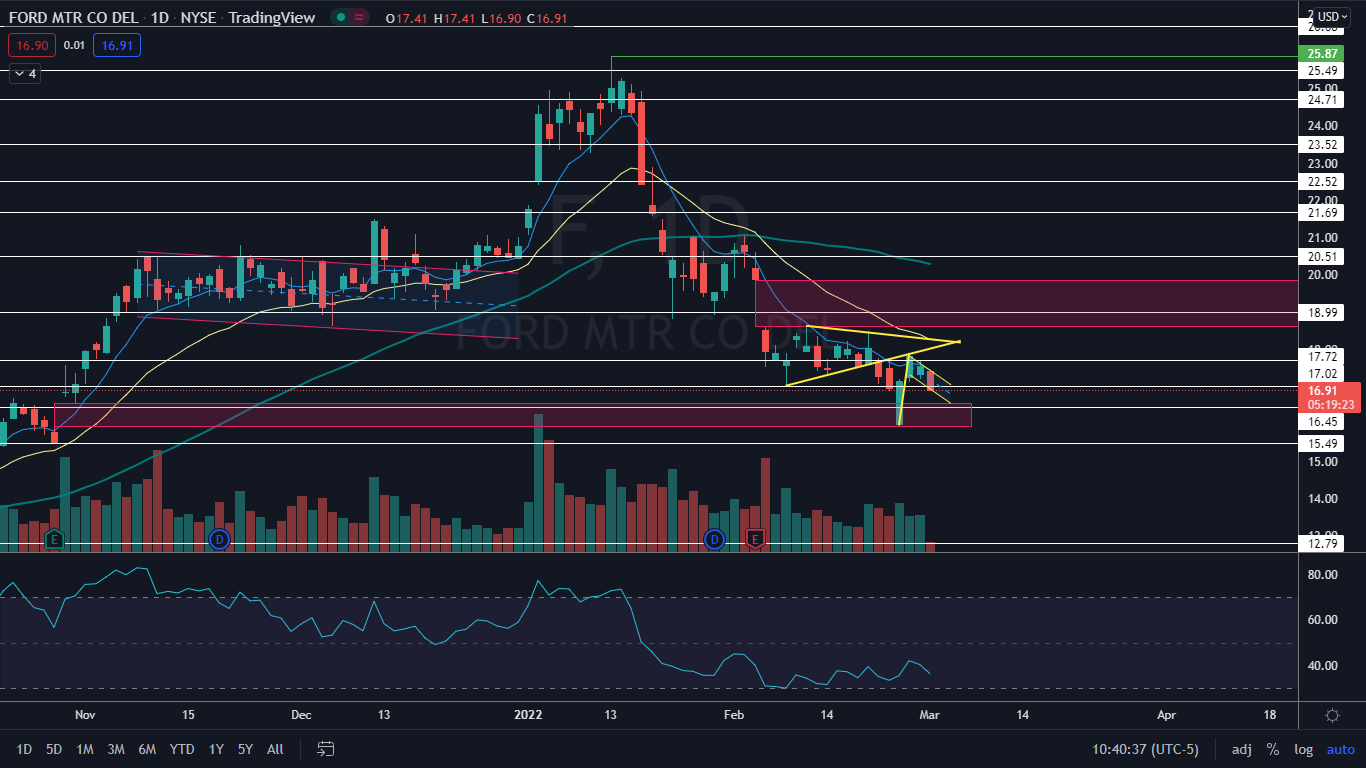
Shares of the automaker soared about 193% between January 2021 and Jan. 13, 2022, when Ford hit a 52-week high of $25.87. Since that date, the stock has been in a downtrend, declining more than 33%. That may be set to change if Ford continues to set up into the bullish pattern it has been creating on the daily chart.
See Also: Mullen Study Shows Mullen FIVE Scores Strong Against Tesla, Ford Models
The Ford Chart: On Feb. 22, Ford broke down bearishly from a triangle pattern and two trading days later, the stock gapped down to open the trading session at $15.99, where bulls came in and bought the dip. The price action caused Ford to fill a lower gap on its chart between $15.92 and $16.55, which should give bulls more confidence going forward.
After gapping down, Ford shot up about 12% between Feb. 24 and Feb. 25 and has since been consolidating the move. In its consolidation, the stock may be settling into a bull flag pattern with the pole created on Thursday and Friday and the flag being created on the days that have followed.
There is a gap above on Ford’s chart between $18.59 and $19.87, which was left behind after the stock suffered a bearish reaction to its earnings print on Feb. 4. Gaps on charts fill about 90% of the time, which makes it likely Ford will trade up into the range in the future.
Ford is trading below the eight-day and 21-day exponential moving averages (EMAs), with the eight-day EMA trending below the 21-day, both of which are bearish indicators. The stock is also trading about 20% below the 50-day simple moving average, which indicates longer-term sentiment is bearish.
Want direct analysis? Find me in the BZ Pro lounge! Click here for a free trial.
- Bulls want to see Ford hold within the flag formation and then for big bullish volume to come in and break Ford up from the pattern, which will cause the stock to regain the eight-day EMA as support. There is resistance above at $17.02 and $17.72.
- Bears want to see big bearish volume come in and drop Ford down below the $16.60 level, which will negate the bull flag pattern. The stock has support below at $16.45 and $15.49.
© 2025 Benzinga.com. Benzinga does not provide investment advice. All rights reserved.
Trade confidently with insights and alerts from analyst ratings, free reports and breaking news that affects the stocks you care about.

