


Zinger Key Points
- Nvidia gapped down to a support level near $209 on Feb. 24, then soar up 16%, the steep reversal to the upside, paired with consolidation has created a bull flag pattern
- Tesla gapped down to a heavy support area near the $700 mark on Feb. 24 and shot up 27% higher, the stock has now also settled into a bull flag pattern.
- Shake Shack also gapped down on Feb. 24, before shooting up 23%, the climb higher may be the pole of a possible bull flag pattern.
- Get access to your new suite of high-powered trading tools, including real-time stock ratings, insider trades, and government trading signals.
NVIDIA Corporation NVDA, Tesla, Inc TSLA and Shake Shack, Inc SHAK have all settled into bullish flag patterns on the daily chart. The bull flag pattern is created with a sharp rise higher forming the pole, which is then followed by a consolidation pattern that brings the stock lower between a channel with parallel lines.
- For bearish traders, the "trend is your friend" (until it's not) and the stock may continue downwards within the following channel for a short period of time. Aggressive traders may decide to short the stock at the upper trendline and exit the trade at the lower trendline.
- Bullish traders will want to watch for a break upward from the upper descending trendline of the flag formation, on high volume, for an entry. When a stock breaks up from a bull flag pattern, the measured move higher is equal to the length of the pole and should be added to the lowest price within the flag.
A bull flag is negated when a stock closes a trading day below the lower trendline of the flag pattern, or if the flag falls more than 50% down the length of the pole.
See Also: Elon Musk Takes A Dig At Lucid, Explains Why He Isn't Pushing For Longest Range EV
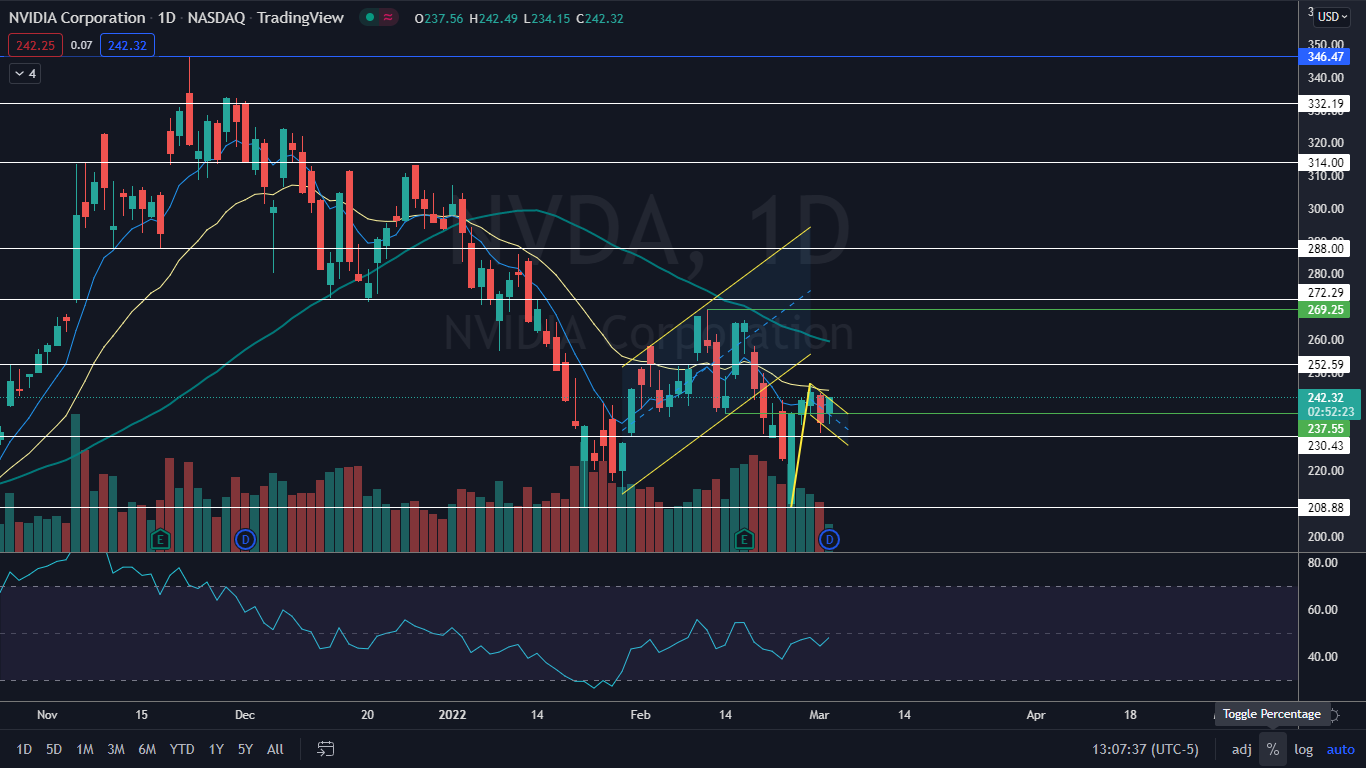
The Nvidia Chart: On Feb. 24, Nvidia gapped down to a support level near $209 where bulls came in heavily and bought the dip, causing the stock to soar up 16% between that date and Feb. 25 and Feb. 28.
- The steep reversal to the upside, paired with the consolidation that has taken place on Mar. 1 and Mar. 2 has settled the stock into a bull flag pattern, with a measured move that could take Nvidia up toward the $270 level if the formation is recognized.
- Traders can watch for an upward break from the parallel flag on higher-than-average volume to gauge that the pattern was recognized.
- Nvidia has resistance above at $252.59 and $272.29 and support below at $230.43 and $208.88.
Want direct analysis? Find me in the BZ Pro lounge! Click here for a free trial.
See Also: Nvidia Hackers Are Selling A Way Around Ethereum GPU Mining Limiter
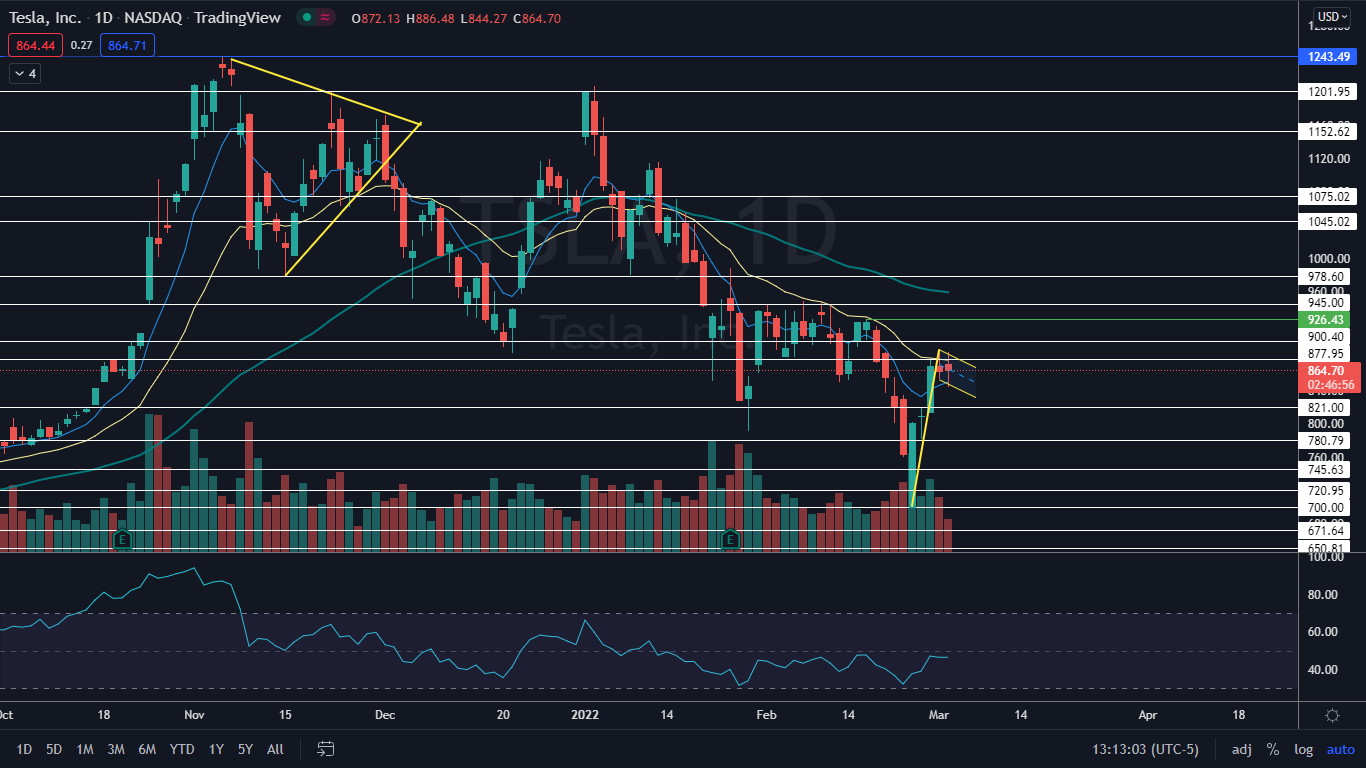
The Tesla Chart: Like Nvidia, Tesla gapped down to a heavy support area near the $700 mark on Feb. 24 and shot up 27% higher over the three trading days that followed.
- The push higher paired with Tuesday and Wednesday’s consolidation has settled the stock into a bull flag pattern, with a move up toward $1,072 if the formation is recognized.
- If Tesla closes the trading day near its opening price, it will print a doji candlestick, which could indicate a higher low is in, and the stock will now trade in an uptrend.
- Tesla has resistance above at $877.95 and $900.40 and support below at $821 and $780.79.
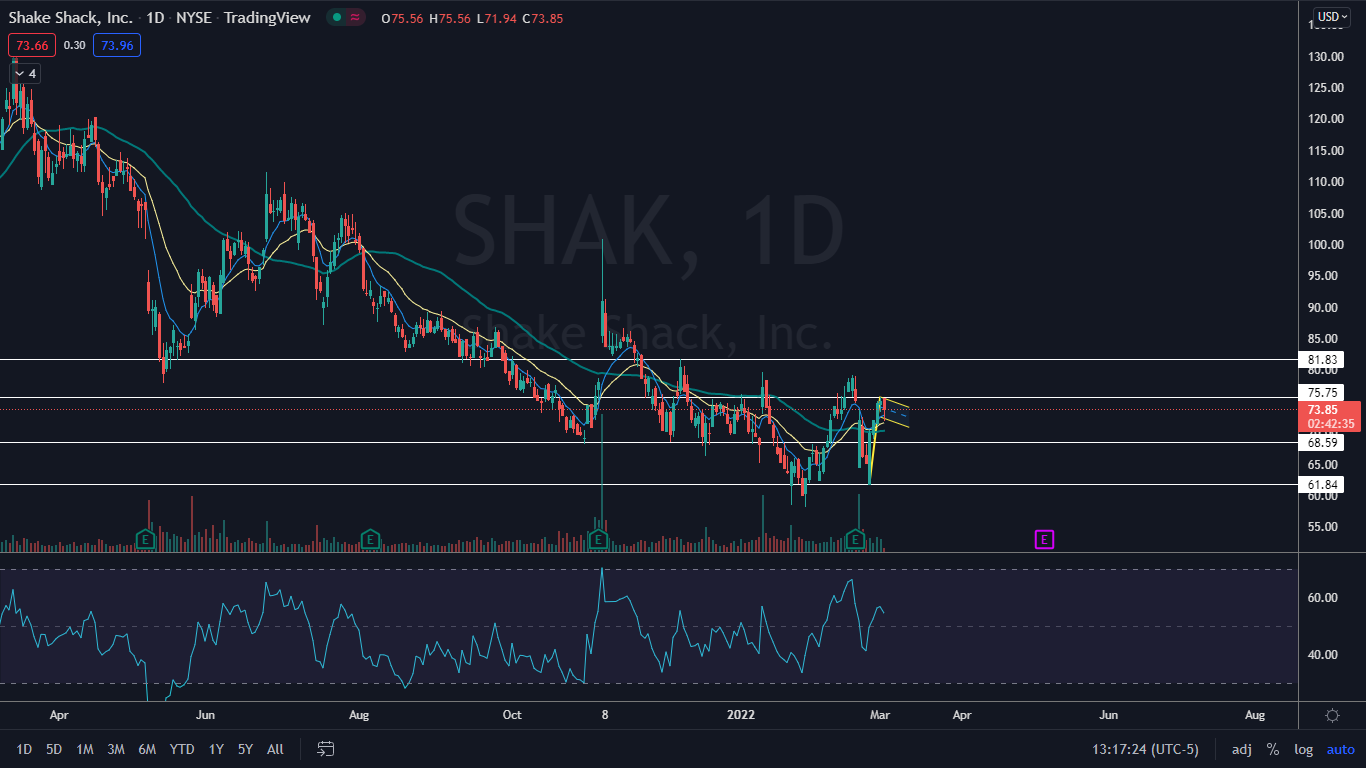
The Shake Shack Chart: Shake Shack also gapped down on Feb. 24, before shooting up 23% over the course of four trading days to reach the $75.75 level.
- The climb higher may be the pole of a possible bull flag pattern and the stock may have begun to form the flag formation on Wednesday, but at least one more candle still likely needs to print for confirmation.
- Shake Shack had lower-than-average volume on its 1.7% decline on Wednesday, which indicates consolidation and should not be a red flag for bullish traders.
- Shake Shack has resistance above at $75.75 and $81.83 and support below at $68.59 and $61.84.
© 2025 Benzinga.com. Benzinga does not provide investment advice. All rights reserved.
Trade confidently with insights and alerts from analyst ratings, free reports and breaking news that affects the stocks you care about.

