Zinger Key Points
- Although both charts look bearish in the short-term, GM and Tesla are settling into patterns that can signal a strong reversal for patient traders.
- Today's manic market swings are creating the perfect setup for Matt’s next volatility trade. Get his next trade alert for free, right here.
General Motors Company GM and Tesla, Inc TSLA have struggled recently, with General Motors plummeting about 33% from its Jan. 5 all-time high of $67.21 and Tesla falling about 32% from its Nov. 4 all-time high of $1,243.49.
Both stocks have been negatively affected by the bearish indecision within the general markets that began in early January, when the reality that the Federal Reserve would raise interest rates in an attempt to combat rising inflation hit home and an increased likelihood of a war in Europe caused investors to feel increasingly hesitant.
Although a rise in interest rates may now be priced in, the ongoing geopolitical and economic risks caused by the Russian invasion of Ukraine continue to weigh on the general market and individual stocks.
For technical traders, both General Motors and Tesla have developed patterns on their charts that can be used to map the stocks’ potential pathways. Although both charts look bearish in the short-term, General Motors and Tesla are settling into patterns that can signal a strong reversal for patient traders.
It should be noted that events affecting the general markets, negative or positive reactions to earnings prints and news headlines can quickly invalidate patterns and breakouts. As the saying goes, "the trend is your friend until it isn't" and any trader in a position should have a clear stop set in place and manage their risk versus reward.
In The News: Despite the daily share price fluctuations, General Motors and Tesla continue working to expand production as the race for dominance in the electric vehicle sector heats up.
In late January, General Motors announced it was investing more than $7 billion to increase its EV production at four Michigan manufacturing sites. The legacy automaker has its sights set on becoming the leader in the industry by 2025.
Tesla has continued to expand its manufacturing capabilities in both the U.S. and abroad, with its Texas Gigafactory nearing operational capability and its Gigafactory in Berlin expected to win approval. The site has suffered several delays over the past year.
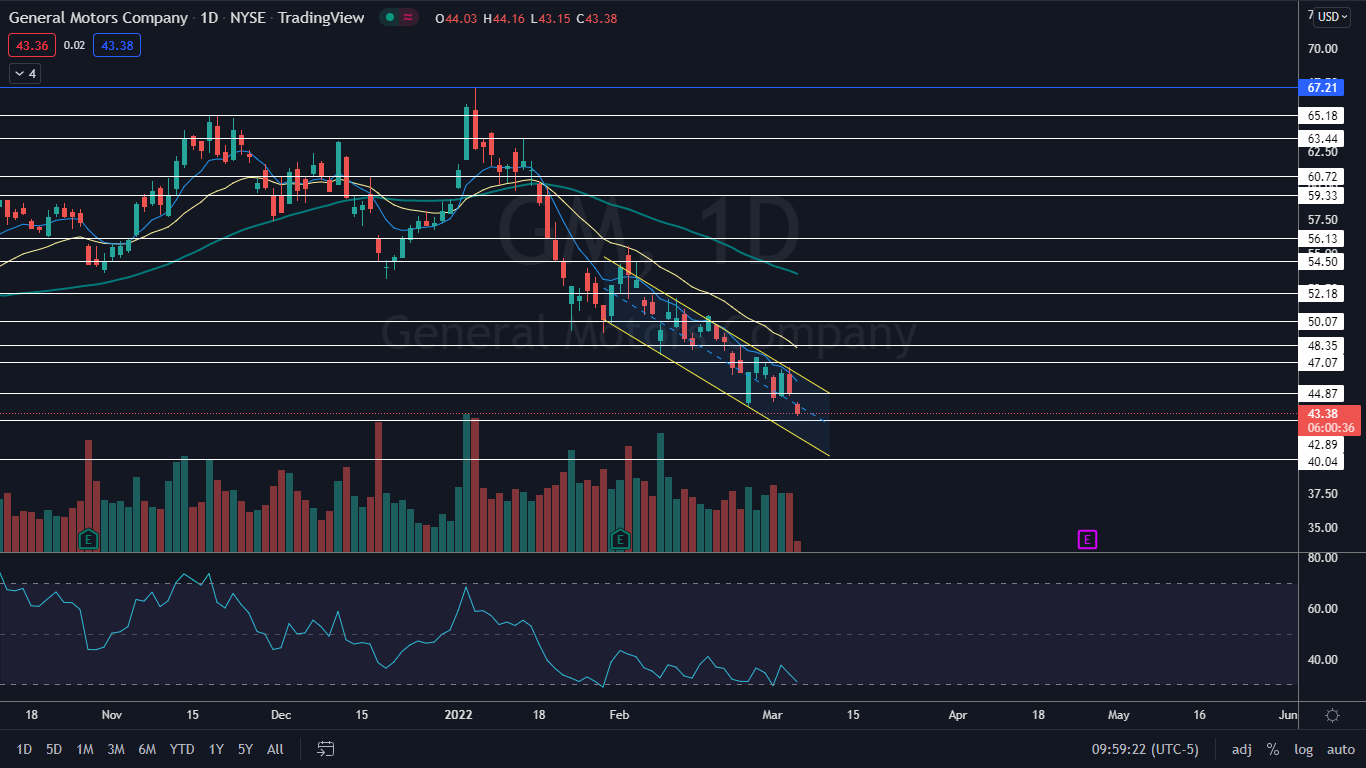
The General Motors Chart: General Motors gapped down slightly lower on Friday and continued to fall, losing over 3% of its value within the first half-hour of trading.
- General Motors is trading in a steep downtrend between two descending parallel lines, which have developed into a falling channel pattern. A falling channel is considered to be bearish until the stock breaches the upper trendline of the pattern on higher-than-average volume, which can be a strong reversal pattern.
- If General Motors falls to the bottom of the channel, bullish traders can watch for the stock to develop a reversal candlestick, which could indicate the stock will at least bounce up higher within the pattern. When General Motors tested the bottom descending trendline on Jan. 31, Feb. 8 and Feb. 21, the stock reacted bullishly and bounced up higher over the days that followed.
- General Motors has resistance above at $44.87 and $47.07 and support below at $42.89 and $40.04.
Want direct analysis? Find me in the BZ Pro lounge! Click here for a free trial.

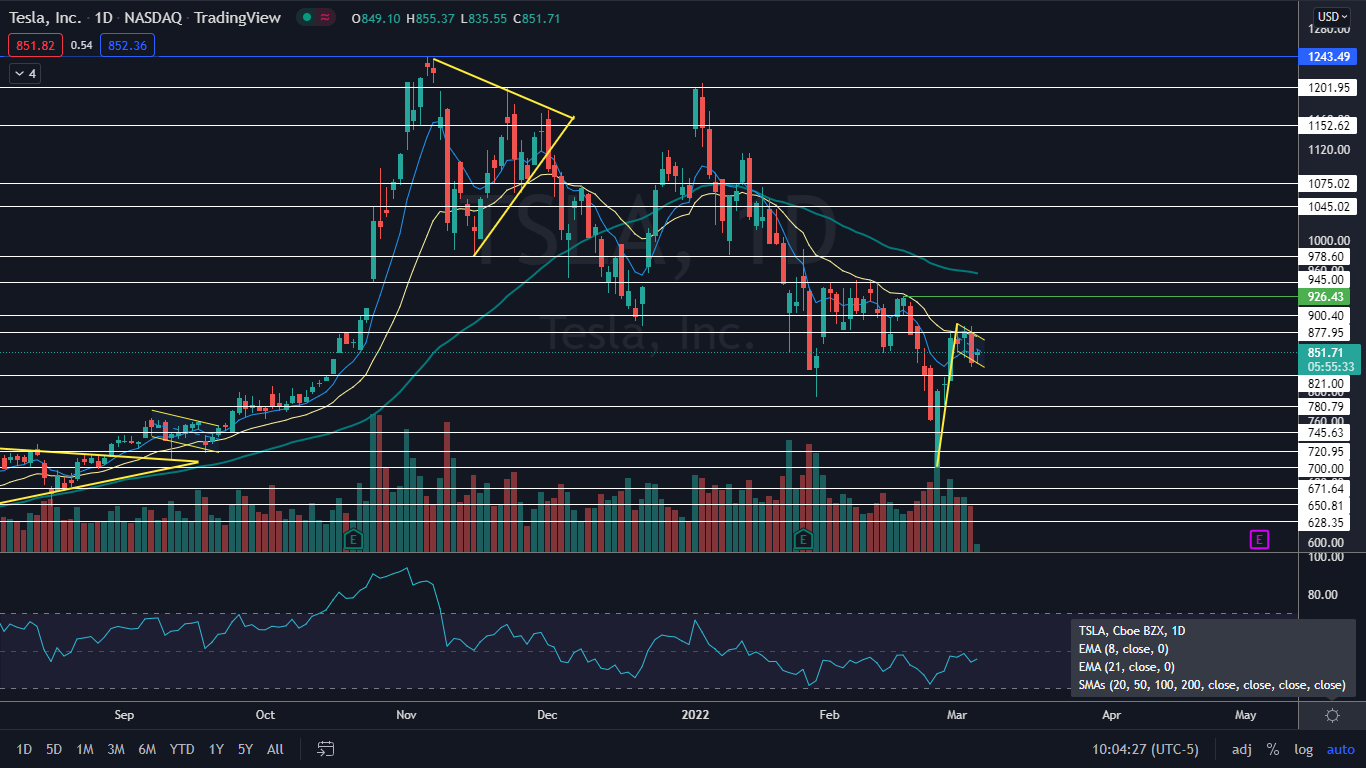
The Tesla Chart: Tesla looks to have reversed into an uptrend on Feb. 24 and may have printed a higher low on Thursday to confirm the trend change, although a higher high above the $890 level would give bullish traders more confidence.
The stock may also be settling into a bull flag pattern on the daily chart, with the pole formed between Feb, 24 and March 1 and the flag forming over the days that have followed. On Friday, Tesla tested the bottom descending trendline of the flag as support and bounced up from the level, which indicates the pattern is likely being recognized.
- Bullish traders can watch for Tesla to break up from the top of the flag formation on higher-than-average volume over the coming days for confirmation that higher prices are likely to come.
- Tesla has resistance above at $877.95 and $900.40 and support below at $821 and $780.79.

Photo: GMC Hummer via GM
Edge Rankings
Price Trend
© 2025 Benzinga.com. Benzinga does not provide investment advice. All rights reserved.
Trade confidently with insights and alerts from analyst ratings, free reports and breaking news that affects the stocks you care about.