American Airlines Group, Inc AAL and United Airlines Holdings, Inc UAL plummeted 25% and 30%, respectively, between March 1 and March 7 amid geopolitical uncertainty and soaring gas prices, which will spill over to ticket prices.
The stocks have mostly been trading in downtrends since March 2021, although American Airlines had one brief flight back up to its March 18 high of $26.10 on June 2. United Airlines reached a high of $63.70 on March 18 and has since slid over 50%, while American Airlines has lost 49% since that same date.
Despite the decline, American Airlines and United Airlines are flashing signals that indicate at least a bounce to the upside may be on the way although a trend reversal that indicates bullish sentiment has returned is likely a long way off.
It should be noted, however, that events affecting the general markets, negative or positive reactions to earnings prints and news headlines can quickly invalidate patterns and breakouts. As the saying goes, "the trend is your friend until it isn't" and any trader in a position should have a clear stop set in place and manage their risk versus reward.
See Also: Why American Airlines, Delta Air Lines And United Airlines Shares Are Falling Today
In The News: Recent analyst ratings on American Airlines and United airlines indicate the firms are bearish on the stocks. On Monday, Seaport Global downgraded American Airlines from Buy to Neutral and removed its price target.
On Feb. 15, Wolfe Research assumed coverage on United Airlines with an Overweight rating and a price target of $41, which at the stock’s current price would represent a 30% move to the upside, although when the price target was announced United Airlines was trading above that level.
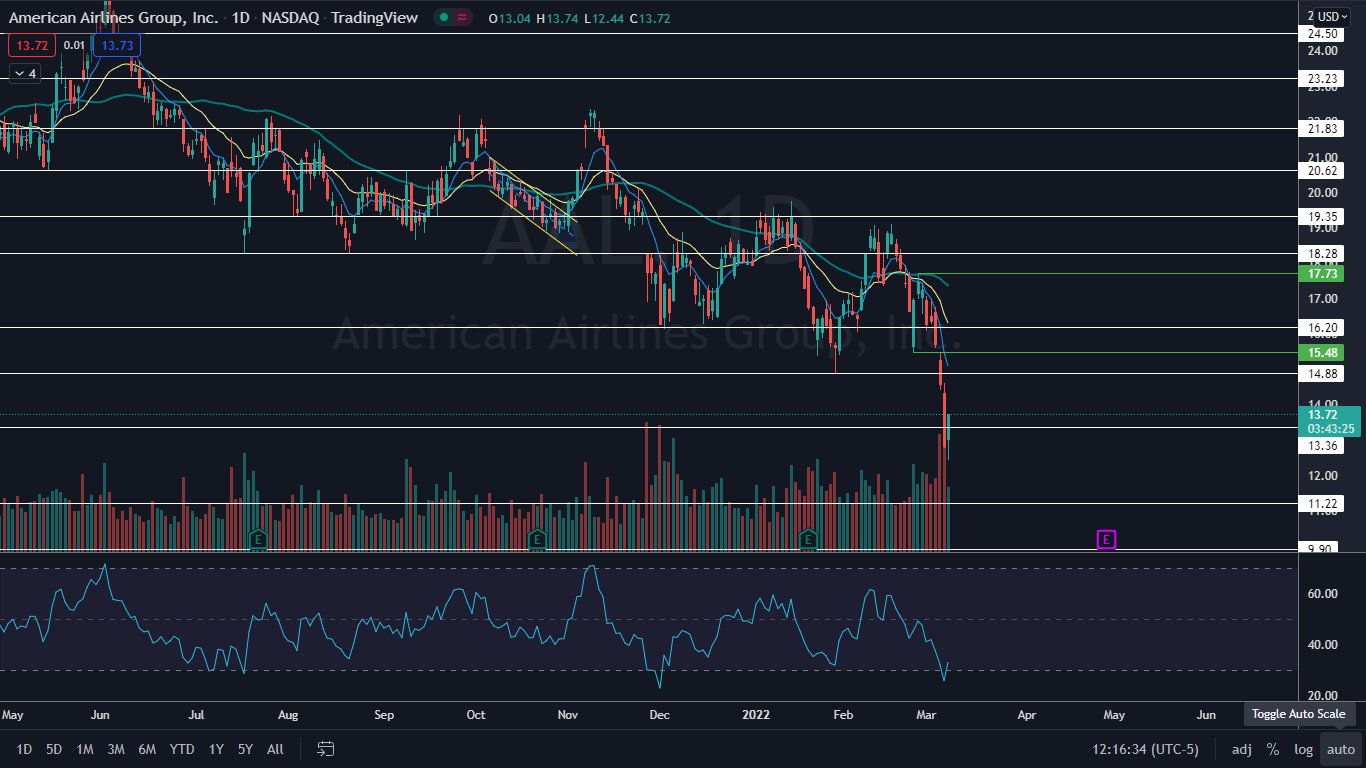
The American Airlines Chart: American Airlines was trading up almost 5% higher on Tuesday, likely as part of a relief bounce due to becoming oversold on the daily chart.
- When a stock’s relative strength index (RSI) reaches or falls below the 30% level it can be a buy signal for technical traders. American Airlines RSI reached 25% on Monday.
- American Airlines is trading in a confirmed downtrend but has not printed a lower high since Feb. 25, when the stock hit the $17.73 mark. To continue in its downtrend, American Airlines will need to print another lower high below that level.
- On Tuesday, American Airlines was looking to print a hammer candlestick on the daily chart, which indicates higher prices may come on Wednesday.
- American Airlines has resistance above at $14.88 and $16.20 and support below at $13.36 and $11.22.
Want direct analysis? Find me in the BZ Pro lounge! Click here for a free trial.

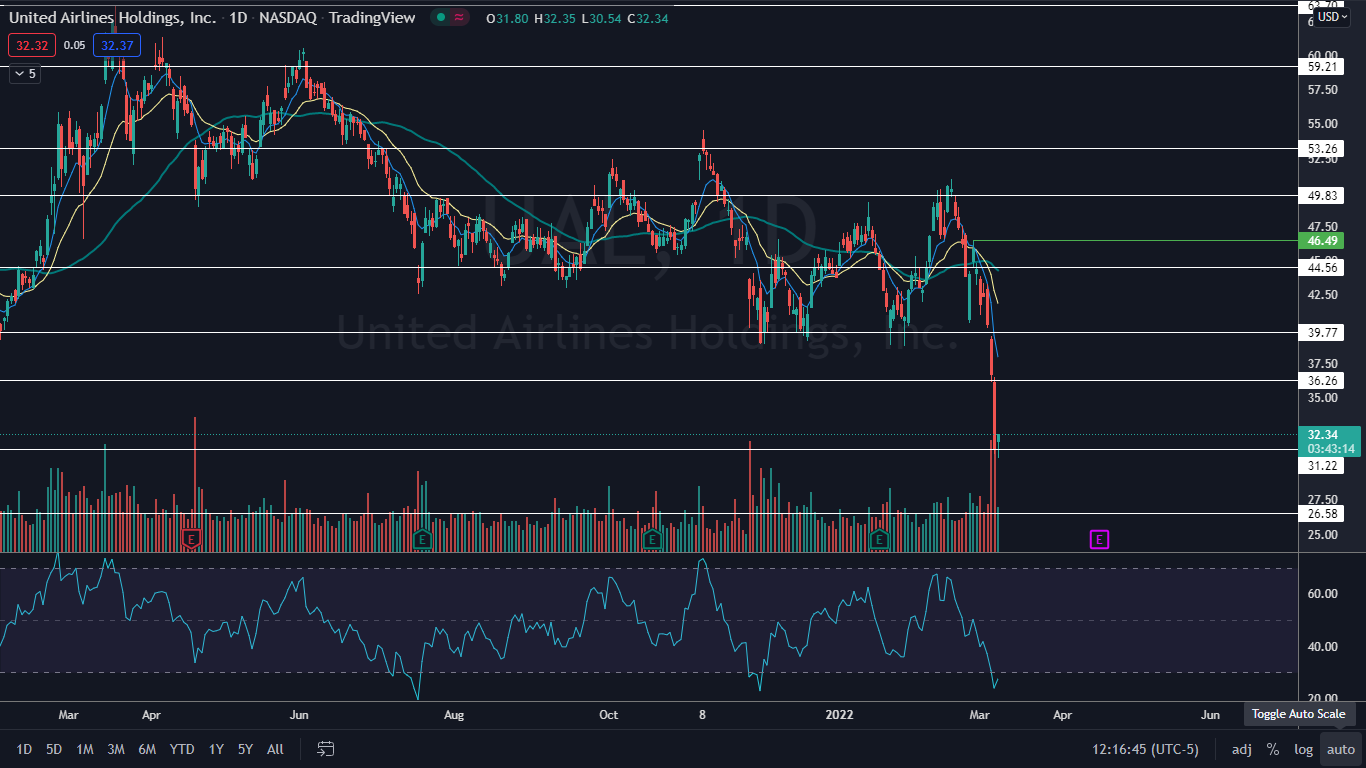
The United Airlines Chart: United Airlines was trading up over 2% higher on Tuesday afternoon after struggling to find buyers in the morning.
- Like American Airlines, United Airlines RSI is at about 25%, which indicates a bounce is likely to come.
- United Airlines has not printed a lower high in its downtrend since the stock reached $46.49 on Feb. 25. A bounce up to print the next consecutive lower high is likely to come soon because like American Airlines, United Airlines was working on printing a hammer candlestick on Tuesday.
- United Airlines has resistance above at $36.26 and $44.56 and support below at $31.22 and $26.58.

Edge Rankings
Price Trend
© 2025 Benzinga.com. Benzinga does not provide investment advice. All rights reserved.
Trade confidently with insights and alerts from analyst ratings, free reports and breaking news that affects the stocks you care about.