


American Airlines Group AAL, Amazon.com, Inc AMZN and Netflix, Inc NFLX are all trading higher in strong uptrends. An uptrend occurs when a stock consistently makes a series of higher highs and higher lows on the chart.
The higher highs indicate the bulls are in control, while the intermittent higher lows indicate consolidation periods. Traders can use moving averages to help identify an uptrend with rising lower timeframe moving averages (such as the eight-day or 21-day exponential moving averages) indicating the stock is in a steep shorter-term uptrend and rising longer-term moving averages (such as the 200-day simple moving average) indicating a long-term uptrend.
A stock often signals when the higher high is in by printing a reversal candlestick such as a doji, bearish engulfing or hanging man candlestick. Likewise, the higher low could be signaled when a doji, morning star or hammer candlestick is printed. Moreover, the higher highs and higher lows typically take place at resistance and support levels.
In an uptrend the "trend is your friend" until it’s not, and in an uptrend there are ways for both bullish and bearish traders to participate in the stock:
- Bullish traders who are already holding a position in a stock can feel confident the uptrend will continue unless the stock makes a lower low. Traders looking to take a position in a stock trading in an uptrend can usually find the safest entry on the higher low.
- Bearish traders can enter the trade on the higher high and exit on the pullback. These traders can also enter when the uptrend breaks and the stock makes a lower low, indicating a reversal into a downtrend may be in the cards.
- See Also: Amazon Introduces Game Replicating Metaverse to Help Users Learn Cloud Computing
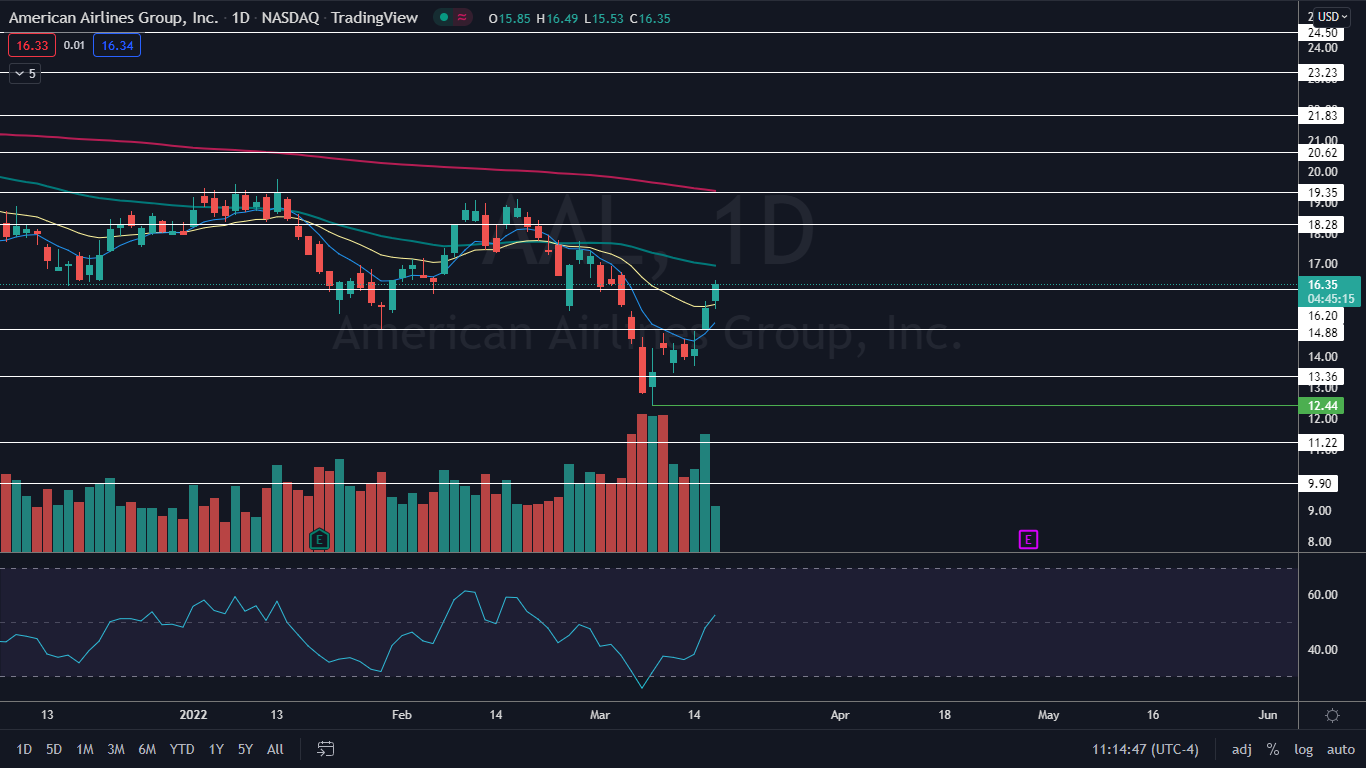
The American Airlines Chart: American Airlines reversed into an uptrend on March 8 when the stock wicked up from the $12.44 level, and has since made a consistent series of higher highs and higher lows. American Airlines’ most recent higher low was formed at the $13.46 mark on March 10, and the stock was working to print a higher high on Wednesday.
- If American Airlines closes the trading day near or below the $16 level, the stock will print either a doji or inverted hammer candlestick, which indicates lower prices may come on Thursday. Potentially setting up the next higher low in the pattern.
- American Airlines has resistance above at $16.20 and $18.28 and support below at $14.48 and $13.36.
Want direct analysis? Find me in the BZ Pro lounge! Click here for a free trial.
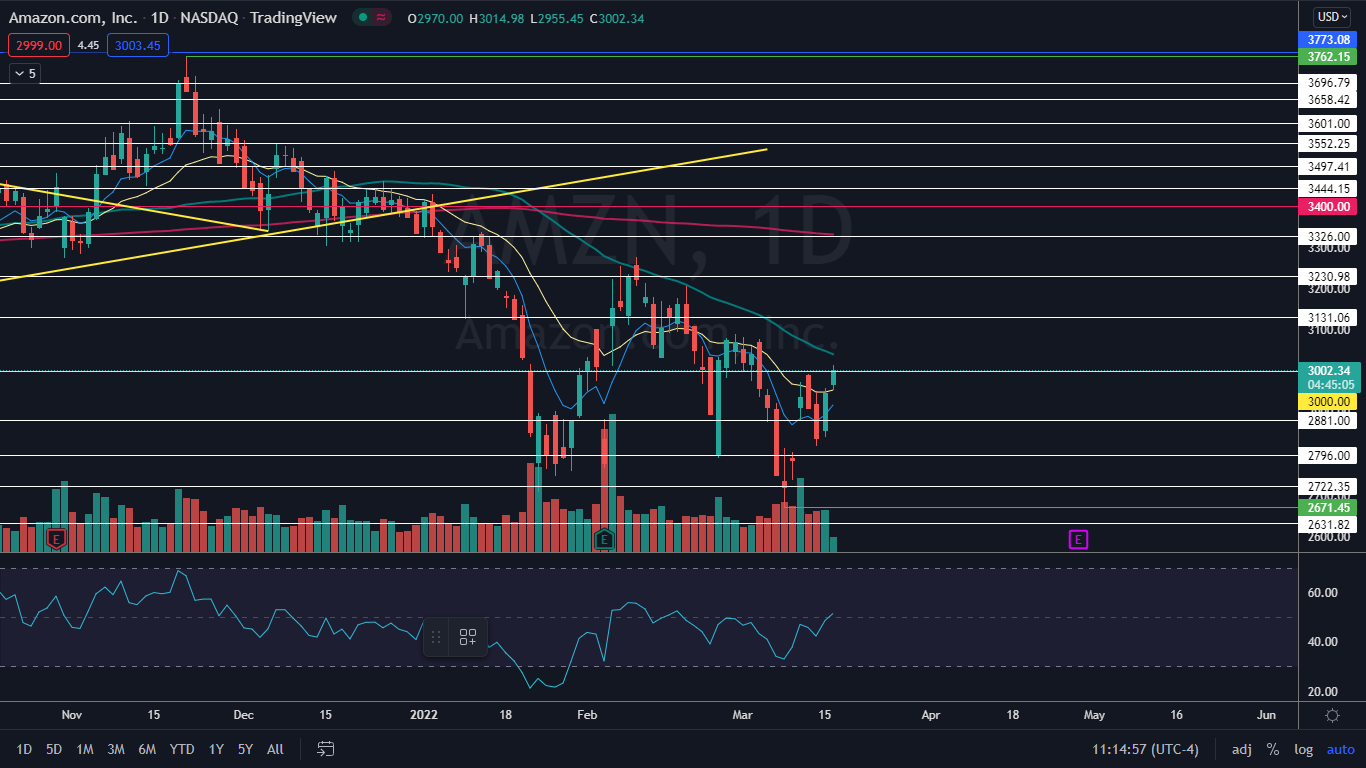
The Amazon Chart: Amazon began trading in a new uptrend when the stock bounced up from near the $2,671 level on March 8. Since that date, Amazon has made a consistent series of higher highs and higher lows, with the most recent higher low created on March 14 at the $2,817.68 level and the most recent higher high possibly printing on Wednesday.
- On Wednesday, Amazon attempted to break up through an important psychological level at $3,000, but was knocked back down below the area. If Amazon is unable to close the trading day above $3,000, the stock may need to print a higher low below the area in order to gain more power.
- Amazon has resistance above that level at $3,131.06 and $3,230.98 and support below at $2,881 and $2,796.
The Netflix Chart: Unlike American Airlines and Amazon, Netflix has not yet confirmed a trend change and is still trading in a downtrend. That may be set to change, however, because on Monday and Tuesday, Netflix may have printed a bullish double bottom pattern near the $330 level.
- On Wednesday, Netflix appeared to be reacting bullishly to the pattern. If the stock is able to garner bullish momentum and push up above the most recent lower high printed on March 10 at $367.02 the downtrend will be negated.
- Netflix has a gap between $458.48 and $506.93, which is about 90% likely to be filled in the future, although it could be a considerable amount of time before that happens.
The stock has resistance above at $364.76 and $386.89 and support below at $352.30 and $337.95.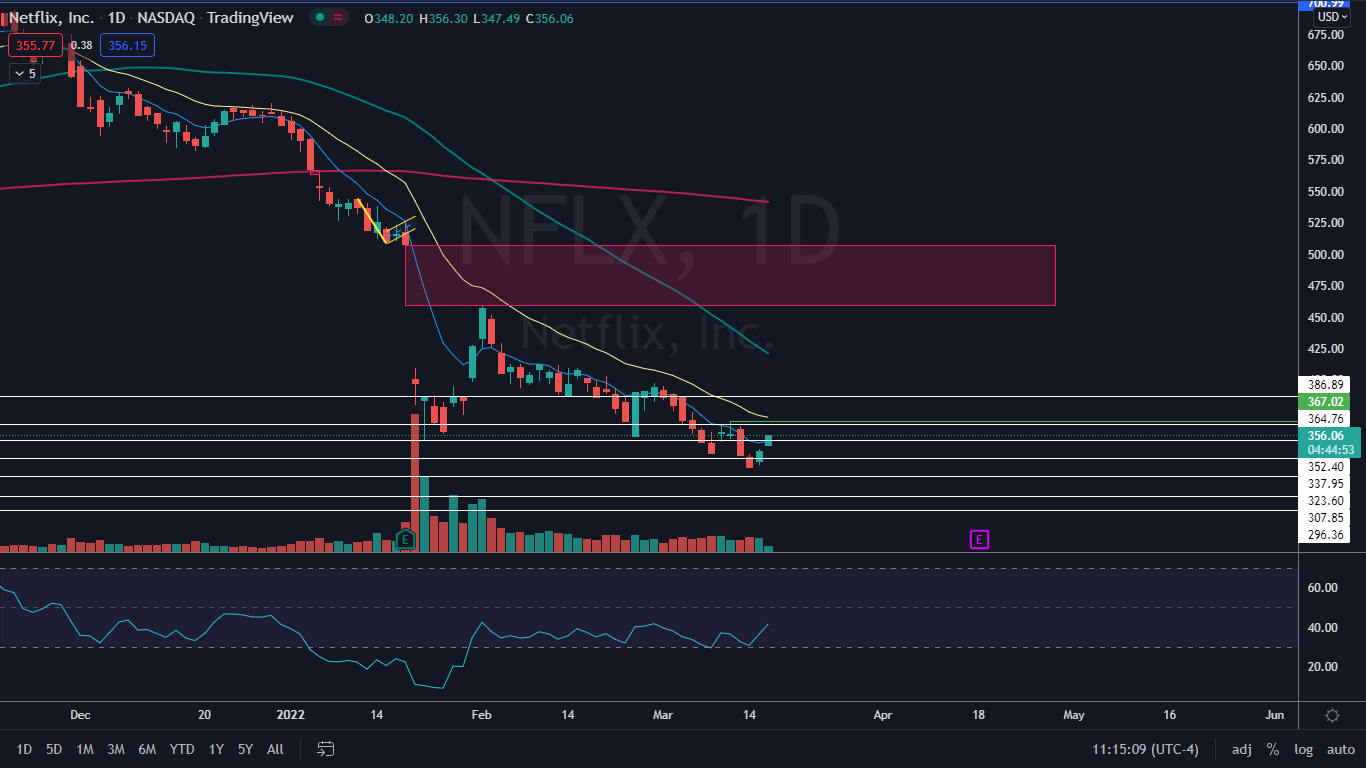
Edge Rankings
Price Trend
© 2025 Benzinga.com. Benzinga does not provide investment advice. All rights reserved.
Trade confidently with insights and alerts from analyst ratings, free reports and breaking news that affects the stocks you care about.

