Zinger Key Points
- The SPY is trading above the eight-day and 21-day EMAs, which is a bullish indicator.
- If the SPY regains the 200-day SMA as support and the 50-day SMA could cross back above it, a bullish golden cross would be created.
- China’s new tariffs just reignited the same market patterns that led to triple- and quadruple-digit wins for Matt Maley. Get the next trade alert free.
The SPDR S&P 500 SPY opened higher on Tuesday and was running up over 1% intraday, which helped the ETF to blast through resistance at the 200-day simple moving average (SMA).
The 200-day SMA is an important bellwether indicator that marks the turning point between what is considered a bull versus a bear market. When the SPY fell through the 200-day on Jan. 21 and again on Feb. 11, fears that a long-term bear market would take hold gripped traders and investors.
That fear grew when Russia invaded Ukraine on Feb. 23 but culminated on March 16 and 17 – the two days the Federal Reserve met, and consequently decided to raise its target interest rate to between .25bps and .5bps. The bullish reaction to the Fed’s decision surprised some traders and investors because most expected a more dovish .25% hike.
The markets can act irrationally, however, and over the course of the past 11 trading days the SPY has shot up over 8%, erasing some of the 13.12% decline that brought the ETF down from its Jan. 4 all-time high of $479.98 to the March 8 closing price of $416.25.
Interesting Fact: The last time a death cross appeared on the SPY's chart was on March 27, 2020, just after the pandemic hit North America. The 50-day SMA continued to trend below the 200-day until July 9 of that year, when a golden cross took place, indicating the last true bear market prior to now lasted 71 trading days. So far this year, the 50-day has been trending below the 200-day for just seven trading days. The shortest amount of time the 50-day has trended below the 200-day was for 39 trading days between July 19, 2006, and Sept. 21 of that year.
See Also: The Stock Market Is Looking Bullish, But When Is The Right Time To Buy?
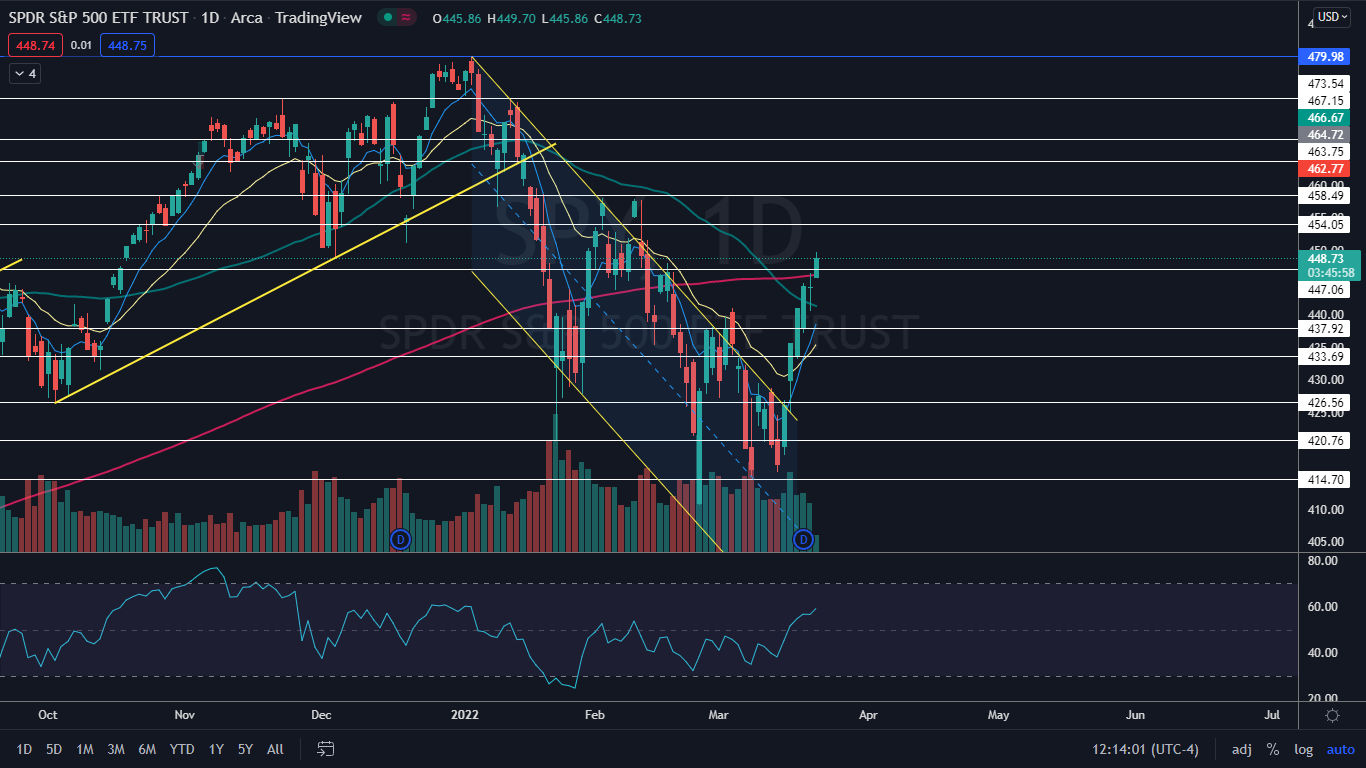
The SPY Chart: On March 14, the SPY suffered a death cross on the daily chart, where the 50-day SMA crossed below the 200-day. Now that the SPY has regained the 200-day SMA as support, the 50-day SMA could cross back above it, which will create a bullish golden cross and give traders and investors more confidence going forward.
If the SPY closes the trading day near its high-of-day, it will print a bullish Marubozu candlestick on the daily chart, which could indicate higher prices will come again on Wednesday. Alternatively, Wednesday could become a day for consolidation and the ETF could print an inside bar pattern, which in this case would lean bullish for Thursday.
If the SPY closes the trading day at or below the $448 level, it will print a shooting star candlestick, which could indicate a retracement is in the cards. A retracement down toward the eight-day exponential moving average (EMA) would still be bullish because it would cause the SPY to print a higher low to confirm the new uptrend. Bullish traders who are not already in a position could watch for a reversal candlestick, such as a doji or hammer, to print on the next pullback to enter into a position.
The SPY is trading above the eight-day and 21-day EMAs, with the eight-day EMA trending above the 21-day, both of which are bullish indicators. If the SPY is able to remain above the 50-day SMA, the indicator will begin to curl upwards, which could give more aggressive traders a cue a golden cross is more likely.
The SPY has resistance above at $454.05 and $458.49 and support below at $447.06 and $437.92.
Want direct analysis? Find me in the BZ Pro lounge! Click here for a free trial.
Edge Rankings
Price Trend
© 2025 Benzinga.com. Benzinga does not provide investment advice. All rights reserved.
Trade confidently with insights and alerts from analyst ratings, free reports and breaking news that affects the stocks you care about.