Nikola Corporation NKLA gapped up over 17% higher on Thursday after an announcement earlier in the week that it would begin commercial truck production, brought renewed interest into the company.
The stock is also trading higher in a strong uptrend. An uptrend occurs when a stock consistently makes a series of higher highs and higher lows on the chart.
The higher highs indicate the bulls are in control while the intermittent higher lows indicate consolidation periods. Traders can use moving averages to help identify an uptrend with rising lower timeframe moving averages (such as the eight-day or 21-day exponential moving averages) indicating the stock is in a steep shorter-term uptrend and rising longer-term moving averages (such as the 200-day simple moving average) indicating a long-term uptrend.
A stock often signals when the higher high is in by printing a reversal candlestick such as a doji, bearish engulfing or hanging man candlestick. Likewise, the higher low could be signaled when a doji, morning star or hammer candlestick is printed. Moreover, the higher highs and higher lows often take place at resistance and support levels.
In an uptrend the "trend is your friend" until it’s not and in an uptrend there are ways for both bullish and bearish traders to participate in the stock:
Bullish traders who are already holding a position in a stock can feel confident the uptrend will continue unless the stock makes a lower low. Traders looking to take a position in a stock trading in an uptrend can usually find the safest entry on the higher low.
Bearish traders can enter the trade on the higher high and exit on the pullback. These traders can also enter when the uptrend breaks and the stock makes a lower low indicating a reversal into a downtrend may be in the cards.
Want direct analysis? Find me in the BZ Pro lounge! Click here for a free trial.
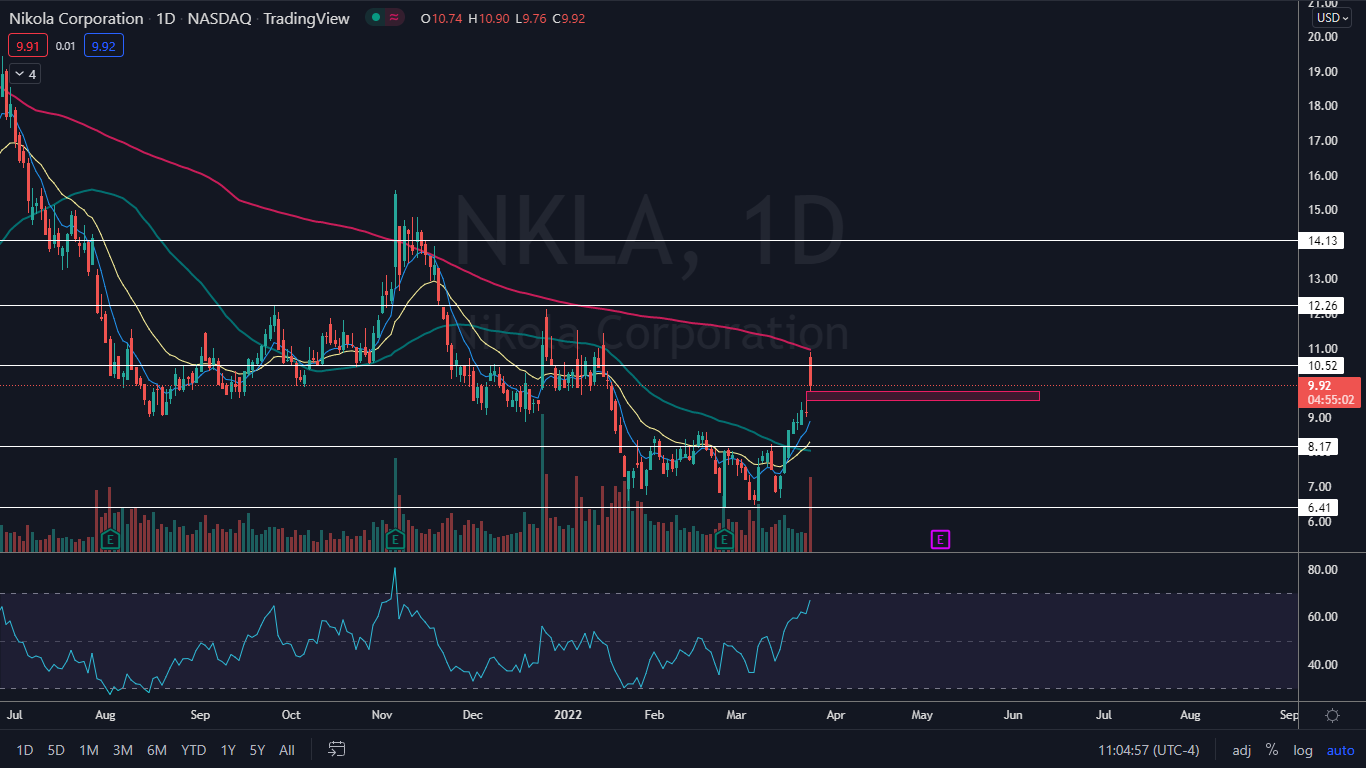
The Nikola Chart: After gapping up to start the day, Nikola ran up into the 200-day simple moving average and rejected, which prompted sellers and profit takers to knock the stock down over 7% off the open. The 200-day SMA is considered to be a bellwether on bullish and bearish sentiment.
- The pullback didn’t negate the uptrend that Nikola has been trading in since Feb. 24, however, and if the stock retraces further to completely fill the gap below, it would give bulls more confidence going forward and provide a possible solid entry for bullish traders who are not already in a position.
- Bullish traders choosing to enter into Nikola may decide to wait until the stock prints a reversal candlestick, such as a doji or hammer candlestick, above the most recent higher flow of $6.66 that was printed on March 16.
- If Nikola closes the trading day near the low-of-day, it will print a bearish Marubozu candlestick, which could indicate lower prices will come on Friday. The stock’s relative strength index is also measuring in at about the 68% level, which also suggests lower prices may be in the cards for the short term because Nikola is reaching overbought territory.
- Nikola has resistance above at $10.52 and $12.26 and support below at $8.17 and $6.41.
© 2025 Benzinga.com. Benzinga does not provide investment advice. All rights reserved.
Trade confidently with insights and alerts from analyst ratings, free reports and breaking news that affects the stocks you care about.

