


Zinger Key Points
- Is Snap ready to bounce back?
- Snap's stock has a 52-week high of $83.34 and a 52-week low of $24.32.
- Don't face extreme market conditions unprepared. Get the professional edge with Benzinga Pro's exclusive alerts, news advantage, and volatility tools at 60% off today.
Snap, Inc SNAP was trading up over 3% on Tuesday according to Benzinga Pro, attempting to break up from a bull flag pattern the stock has settled into on the daily chart.
The bull flag pattern is created with a sharp rise higher forming the pole, which is then followed by a consolidation pattern that brings the stock lower between a channel with parallel lines.
- For bearish traders, the "trend is your friend" (until it's not) and the stock may continue downwards within the following channel for a short period of time. Aggressive traders may decide to short the stock at the upper trendline and exit the trade at the lower trendline.
- Bullish traders will want to watch for a break up from the upper descending trendline of the flag formation, on high volume, for an entry. When a stock breaks up from a bull flag pattern, the measured move higher is equal to the length of the pole and should be added to the lowest price within the flag.
A bull flag is negated when a stock closes a trading day below the lower trendline of the flag pattern or if the flag falls more than 50% down the length of the pole.
See Also: How to Read Candlestick Charts for Beginners
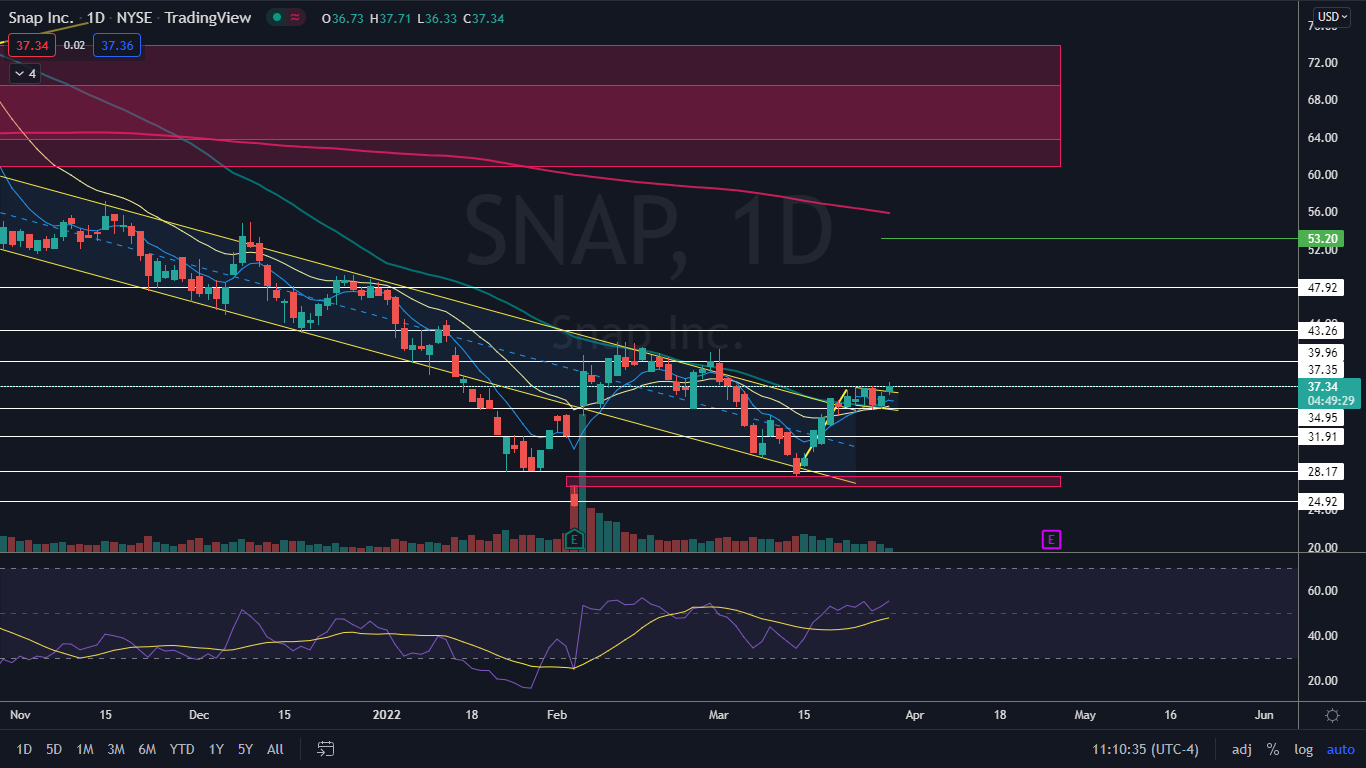
The Snap Chart: Snap reversed north on March 15 after printing a double bottom pattern near the $28.17 level on that day and the trading day prior. The reversal to the upside, paired with the sideways consolidation that took place between March 23 and Monday, has created a bull flag pattern and on Tuesday the stock was attempting to break up from the pattern but was being held down by low volume.
- The measured move, if bullish momentum comes in later on Tuesday or on Wednesday, is about 30%, which indicates Snap could trade up toward the $45 level in the future.
- Snap is also trading in a confirmed uptrend, with the most recent higher low created on Friday at the $34.75 mark and the most recent higher high formed on Tuesday. When the stock falls down to print its next higher low above the $35 level, it may provide bullish traders who aren’t already in a position with a solid entry point.
- Snap has one gap below and one gap above on its chart, with the lower gap between $26.49 and $27.67 and the upper gap between the $60.78 and $73.89 range. Gaps on charts fill about 90% of the time, which makes it likely Snap will fill both ranges in the future.
- Snap is trading above the eight-day and 21-day exponential moving averages (EMAs), with the eight-day EMA trending above the 21-day, both of which are bullish indicators.
- Snap has resistance above at $37.35 and $39.96 and support below at $34.95 and $31.91.
Want direct analysis? Find me in the BZ Pro lounge! Click here for a free trial.
Edge Rankings
Price Trend
© 2025 Benzinga.com. Benzinga does not provide investment advice. All rights reserved.
Trade confidently with insights and alerts from analyst ratings, free reports and breaking news that affects the stocks you care about.

