Acushnet Holdings Corp. GOLF and Callaway Golf Company ELY were trading about 1.9% and 1.5% higher, respectively, on Friday as the second day of the Masters Tournament was underway.
The two golf stocks have taken a beating over the past months, with Acushnet falling 28% from its Nov. 5, 2021 and Nov. 8, 2021 all-time high of 57.87 and Callaway plummeting 40% since reaching an all-time high of 37.75 on June 1.
Shortly after the 2021-2021 Masters Tournament, which ran between April 8 and April 11, Acushnet and Callaway began to swing higher, with Acushnet flying 37% between April 30 and the subsequent all-time high and Callaway shooting up 38% between April 12 and its all-time high. Like this year, neither stock moved substantially higher going into the Master’s weekend.
The stocks could be set for a larger reversal to the upside in the days and weeks that follow because Acushnet and Callaway have both printed bullish double bottom patterns on the daily chart, which indicates a trend change is likely to begin.
It should be noted, however, that events affecting the general markets, negative or positive reactions to earnings prints and news headlines can quickly invalidate patterns and breakouts. As the saying goes, "the trend is your friend until it isn't" and any trader in a position should have a clear stop set in place and manage their risk versus reward.
Want direct analysis? Find me in the BZ Pro lounge! Click here for a free trial.
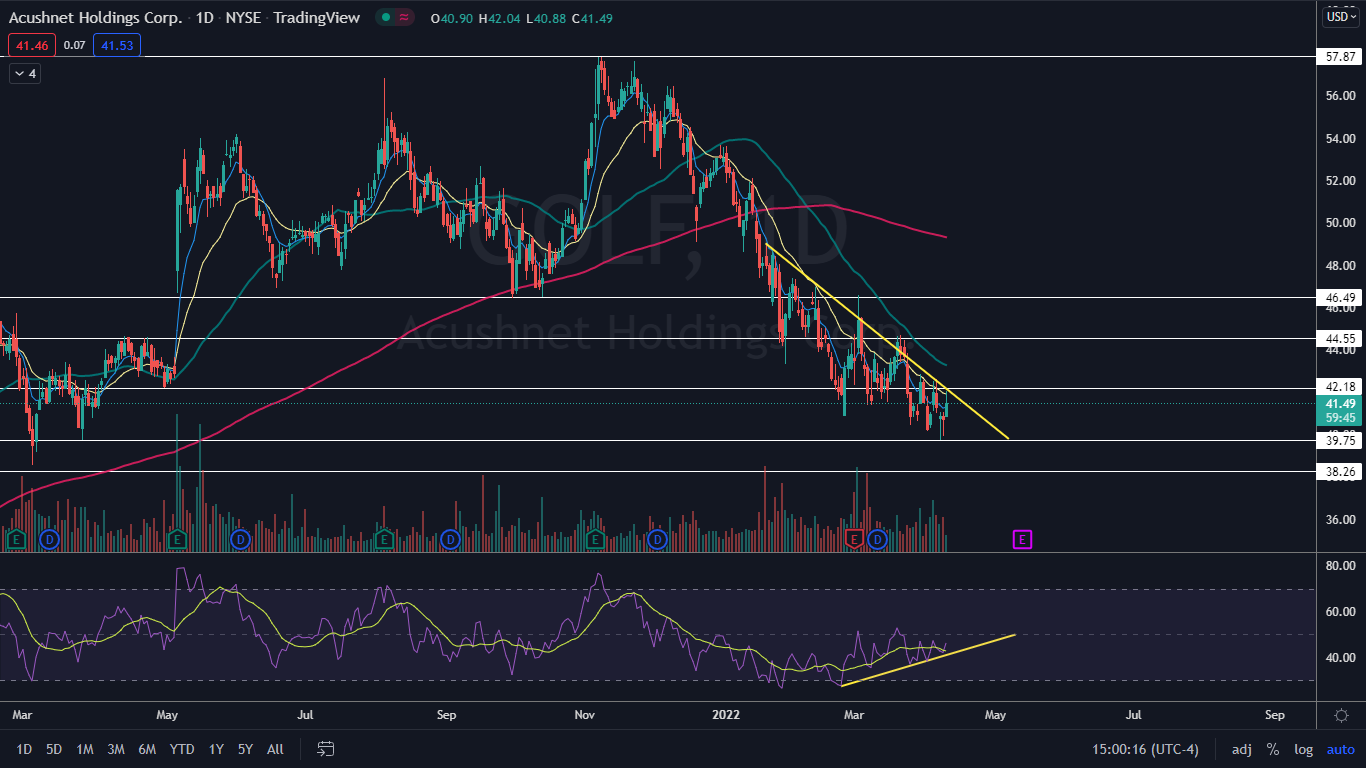
The Acushnet Chart: Acushnet has been trading in a fairly consistent downtrend since reaching its all-time high, and on Jan. 20, the stock began to develop a descending trendline, which has been acting as heavy resistance. On Friday, Acushnet attempted to break up bullishly from the trendline but failed and wicked from the level.
- The move higher to the trendline may have been caused by a double bottom pattern that Acushnet printed on Wednesday and Thursday near the $39.75 level. If the pattern continues to be recognized on Monday and big bullish volume comes in, it may give Acushnet enough power to break up from the descending trendline, which could indicate a larger reversal is in the cards.
- Acushnet’s most recent higher low was printed on April 5 at $42.62 and the most recent lower low was formed at the double bottom. If the stock is able to break up from the trendline, it will print a higher high, which will negate the current trend.
- The stock has developed bullish divergence on the daily chart, where the relative strength index (RSI) has been in an uptrend while the stock moves in the opposite direction. This makes it likely that Acushnet will trade up higher in the future to correct the divergence.
- Acushnet has resistance above at $42.18 and $44.55 and support below at $39.75 and $38.26.

See Also: How Have Golf Stocks Performed Since Tigers Woods Won The Masters In 2019?
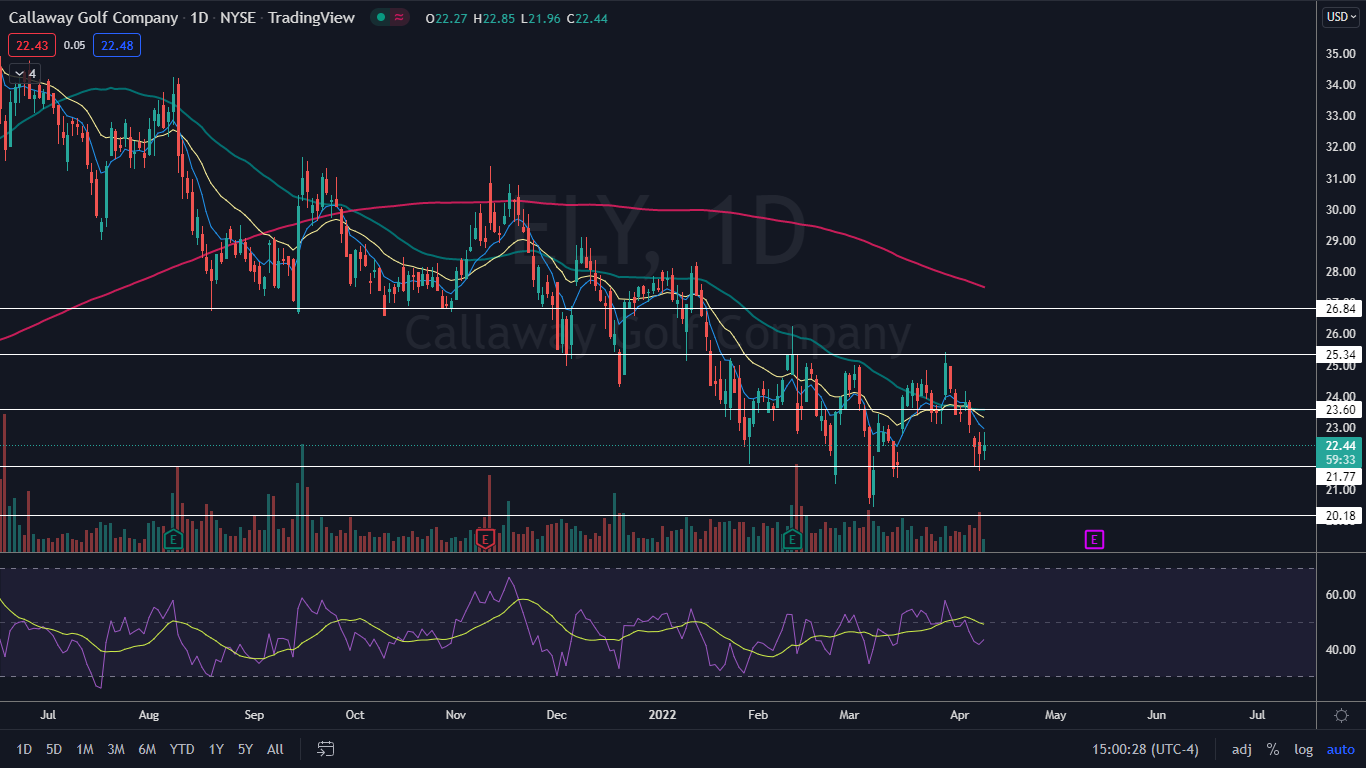
The Callaway Chart: Callaway also printed a double bottom pattern on Wednesday and Thursday but at the $21.77 mark. On Friday, the stock moved higher in reaction to the double bottom but was unable to surpass Thursday’s high-of-day, which has settled the stock into an inside bar pattern.
- The inside bar pattern is neutral in this case, and traders and investors can watch for a break up or down from Thursday’s mother bar on Monday to gauge future direction.
- Callaway’s current downtrend began on March 29, with the most recent lower high created on April 4 at $24.18 and the most recent lower low printed at the double bottom level.
- If the stock reacts bullishly to the double bottom pattern and inside bar formation on Monday, bullish traders will want to see Callaway regain support at the eight-day exponential moving average on the next leg up.
- Callaway has resistance above at $23.60 and $26.84 and support below at $21.77 and $20.18.

Edge Rankings
Price Trend
© 2025 Benzinga.com. Benzinga does not provide investment advice. All rights reserved.
Trade confidently with insights and alerts from analyst ratings, free reports and breaking news that affects the stocks you care about.