


Zinger Key Points
- If Nio confirms an inverted head and shoulders pattern, the stock could soar up over the $40 level in the future.
- If the bear flag becomes the dominant pattern, Nio could fall back toward $16 level.
- Don't face extreme market conditions unprepared. Get the professional edge with Benzinga Pro's exclusive alerts, news advantage, and volatility tools at 60% off today.
Nio, Inc NIO was trading over 5% higher at one point on Wednesday, as the stock continued to reverse course after hitting a bottom at the $17.77 level on April 11.
The Shanghai-based electric vehicle manufacturer may be completing the final right shoulder in a bullish inverted head-and-shoulders pattern.
An inverted head-and-shoulder pattern can be either a powerful reversal indicator when found at the bottom of a downtrend or a continuation pattern found in an uptrend.
The pattern is created when a security forms a rounded or V-shaped trough and then rises (right shoulder) followed by a second deeper downturn and accompanying rise (head) and then by a third trough and rise that is shallower than the second (left shoulder).
The inverted head-and-shoulder pattern has a neckline, which is drawn using a straight ascending, descending or horizontal trendline across the peaks in the pattern.
When the security breaks up through the neckline on higher-than-average volume, it indicates the pattern was recognized and a rally may follow.
- Aggressive bullish traders may choose to enter a security in a head-and-shoulders pattern on the rise following the third trough, with a stop below the lowest price in the trough. More conservative traders may wait to enter a position on a break up from the neckline.
- Bearish traders may wait to enter into a position if the security falls below the lowest price within the second trough, which negates the bullish head-and-shoulders pattern and indicates an accelerated move to the downside may follow.
Want direct analysis? Find me in the BZ Pro lounge! Click here for a free trial.
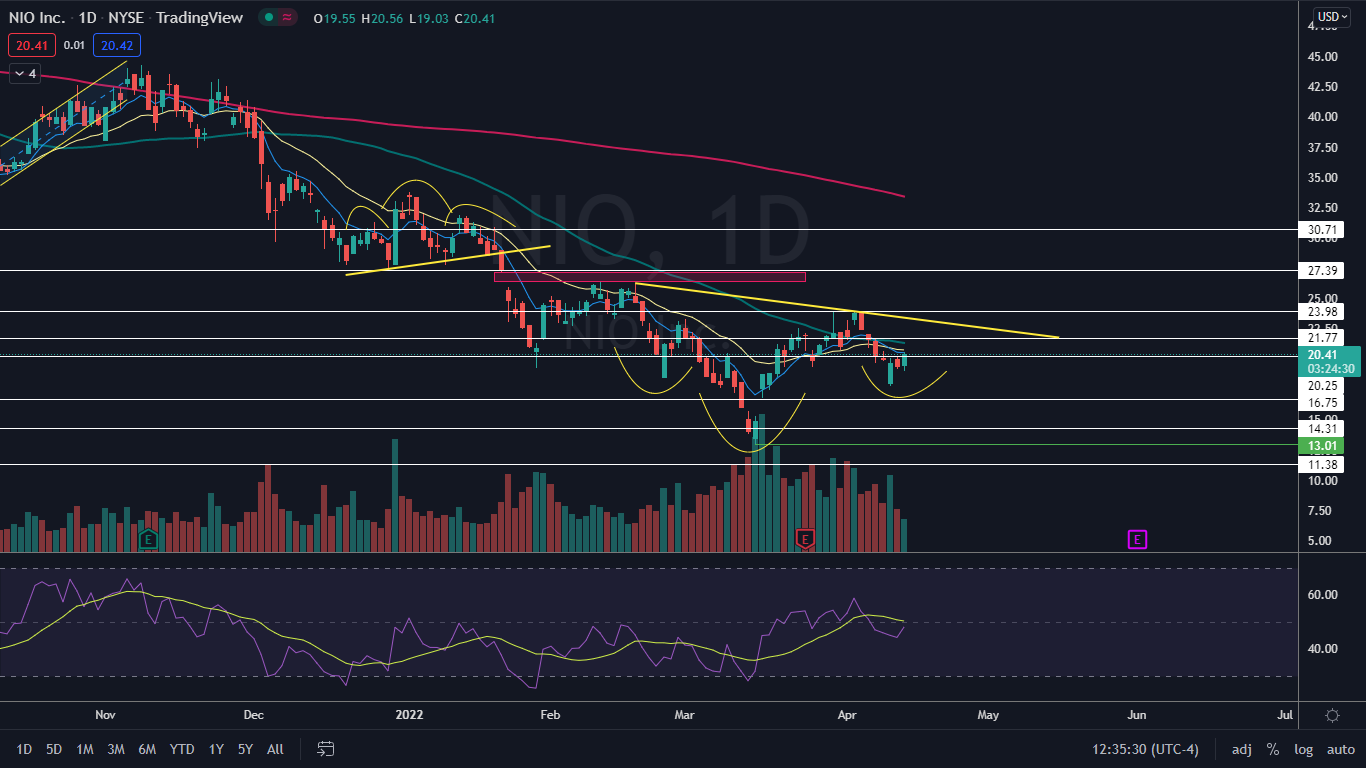
The Nio Chart: Nio began settling into an inverted head-and-shoulders pattern on Feb. 17, completing the left shoulder of the formation between that date and March 1, the head between March 2 and April 4 and working to form the right shoulder between April 5 and Wednesday. The right shoulder is not completed yet, however, and will need additional trading days, where Nio trades up higher toward the neckline, in order to further confirm the pattern.
- If Nio reaches the neckline of the pattern and then breaks up through the area on higher-than-average volume, it will confirm the pattern was recognized by the algorithms.
- The measured move, if the pattern becomes completed and recognized, is about 91%, which indicates Nio could soar up over the $40 level in the future.
- For bearish traders, there is a possibility a bear flag pattern is being developed on the daily chart, with the pole created between April 5 and April 11. If the bear flag becomes the dominant pattern, the measured move is about 19%, which indicates Nio could fall back toward $16 level. The possible bear flag will be negated if the stock is able to recapture the eight-day EMA as support.
- Nio has resistance above at $21.77 and $23.98 and support below at $20.25 and $16.75.
See Also: Taiwan Production Takes A Hit From China Lockdowns
Edge Rankings
Price Trend
© 2025 Benzinga.com. Benzinga does not provide investment advice. All rights reserved.
Trade confidently with insights and alerts from analyst ratings, free reports and breaking news that affects the stocks you care about.

