Zinger Key Points
- Camber Energy is also more volatile than many other stocks in the energy sector due to its small float of just 23.43 million shares.
- Camber Energy has resistance above at 85 cents and $1 and support below at $70 cents and the 52-cent area.
- China’s new tariffs just reignited the same market patterns that led to triple- and quadruple-digit wins for Matt Maley. Get the next trade alert free.
Camber Energy Inc CEI was trading slightly higher in the premarket on Thursday after soaring almost 20% intraday on Wednesday amid a spike in crude oil prices.
The energy sector has seen increased volatility following Russia’s invasion of Ukraine, as traders and investors attempt to weigh the effect the conflict will have on global oil supplies while receiving mixed signals from the European Union about whether it plans to hit Russia with an energy embargo.
Camber Energy is also more volatile than many other stocks in the energy sector due to its small float of just 23.43 million shares. Stocks with a low float can be especially volatile because the impact of supply and demand can be easily tipped due to the small number of shares available for trading.
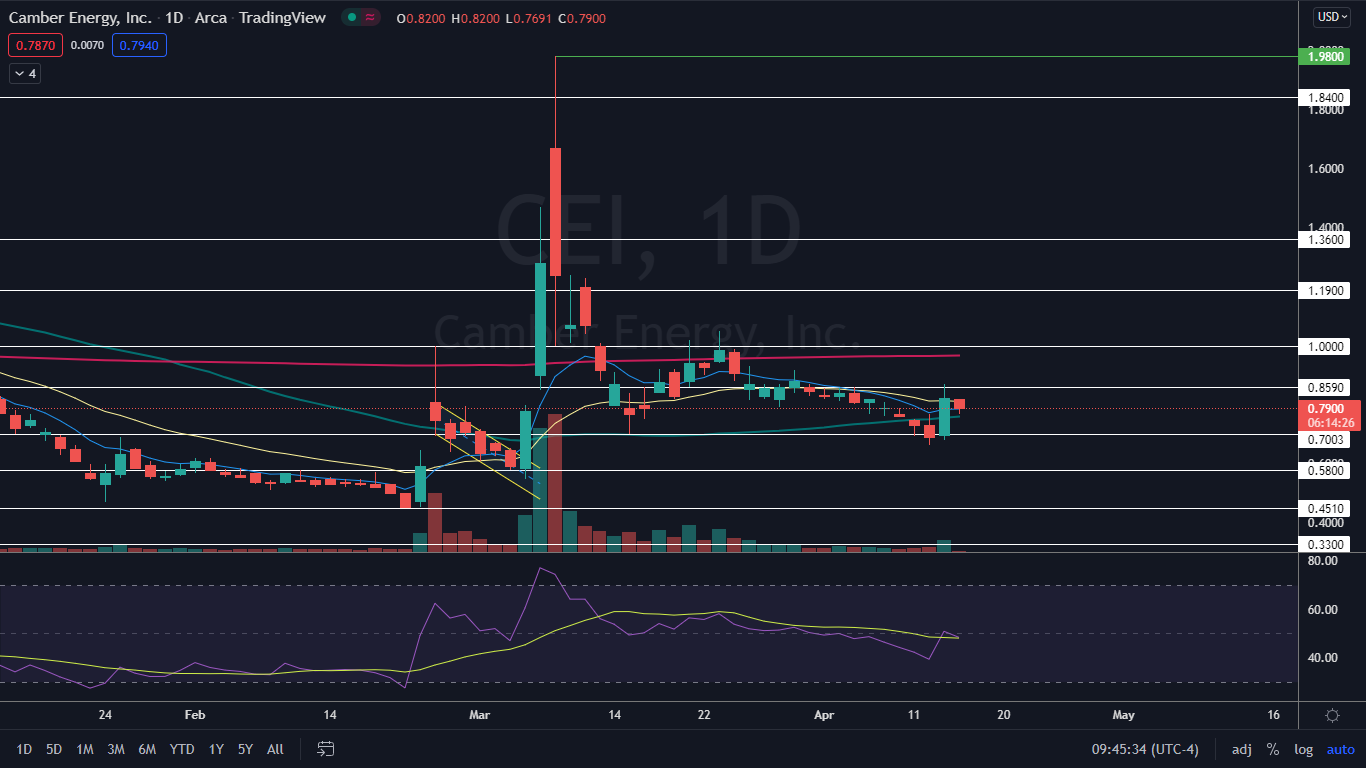
The stock has had multiple periods of increased volatility over the past year, skyrocketing 1,369% between Aug. 20 and Sept. 19, 2021, to reach a high of $4.85 before declining 90% to hit a Feb. 22 low of 45 cents. More recently, Camber Energy soared up 336% between the Feb. 23 low at the 45-cent mark to reach a March 8 high of $1.98 before dropping 66% to bottom at the 66-cent level on Tuesday.
Want direct analysis? Find me in the BZ Pro lounge! Click here for a free trial.
The Camber Energy Chart: On Wednesday, Camber Energy attempted to buck the downtrend it has been trading in since March 23, but came in about five cents shy of printing a high above the most recent lower high of 91 cents, which was printed on March 30.
On Thursday, Camber Energy looked to be consolidating Wednesday’s rise with an inside bar.
The inside bar in this case leans bullish because the stock was trading higher before forming the pattern. Traders and investors can watch for a break of Wednesday’s mother bar later on Thursday or on Monday to gauge the future direction.
As long as Camber Energy doesn’t break down bearishly from the inside bar pattern, Thursday’s price action will create a higher low, which could signal Camber Energy is about to reverse course into an uptrend. Traders and investors will want to see the stock print the higher low on lower-than-average volume as an indication that higher prices may be in the cards.
If Camber Energy is able to break bullishly from the inside bar pattern, it will regain the 21-day exponential moving average (EMA) as support and if the stock can remain above the level for a period of time, the eight-day EMA will cross above the 21-day, which would give bulls more confidence going forward.
Camber Energy has resistance above at 85 cents and $1 and support below at $70 cents and the 52-cent area.
© 2025 Benzinga.com. Benzinga does not provide investment advice. All rights reserved.
Trade confidently with insights and alerts from analyst ratings, free reports and breaking news that affects the stocks you care about.
 See Also: