Zinger Key Points
- AMC's stock has a 52-week high of $72.62 and a 52-week low of $8.90 per share.
- Get Pro-Level Earnings Insights Before the Market Moves
On Sunday evening, Benzinga asked its followers on Twitter what they’re buying at the open on Monday. From the replies Benzinga selected one ticker for technical analysis.
alberto (@alberto92445611) is buying AMC Entertainment Holdings Inc AMC.
On Friday, AMC CEO Adam Aron announced that moviegoers could now pay for tickets using Dogecoin DOGE/USD, Shiba Inu SHIB/USD and other cryptocurrencies through the AMC mobile app. AMC began allowing purchases of tickets and concessions using Bitcoin on its website in 2021 and added Dogecoin and Shiba Inu as payment options in March.
The ability to make payments with cryptocurrencies through AMC’s smartphone app is likely to increase the number of cryptocurrency transactions that AMC completes. About 14% of all AMC’s transactions were already completed using cryptocurrency prior to the system being made available on the official app.
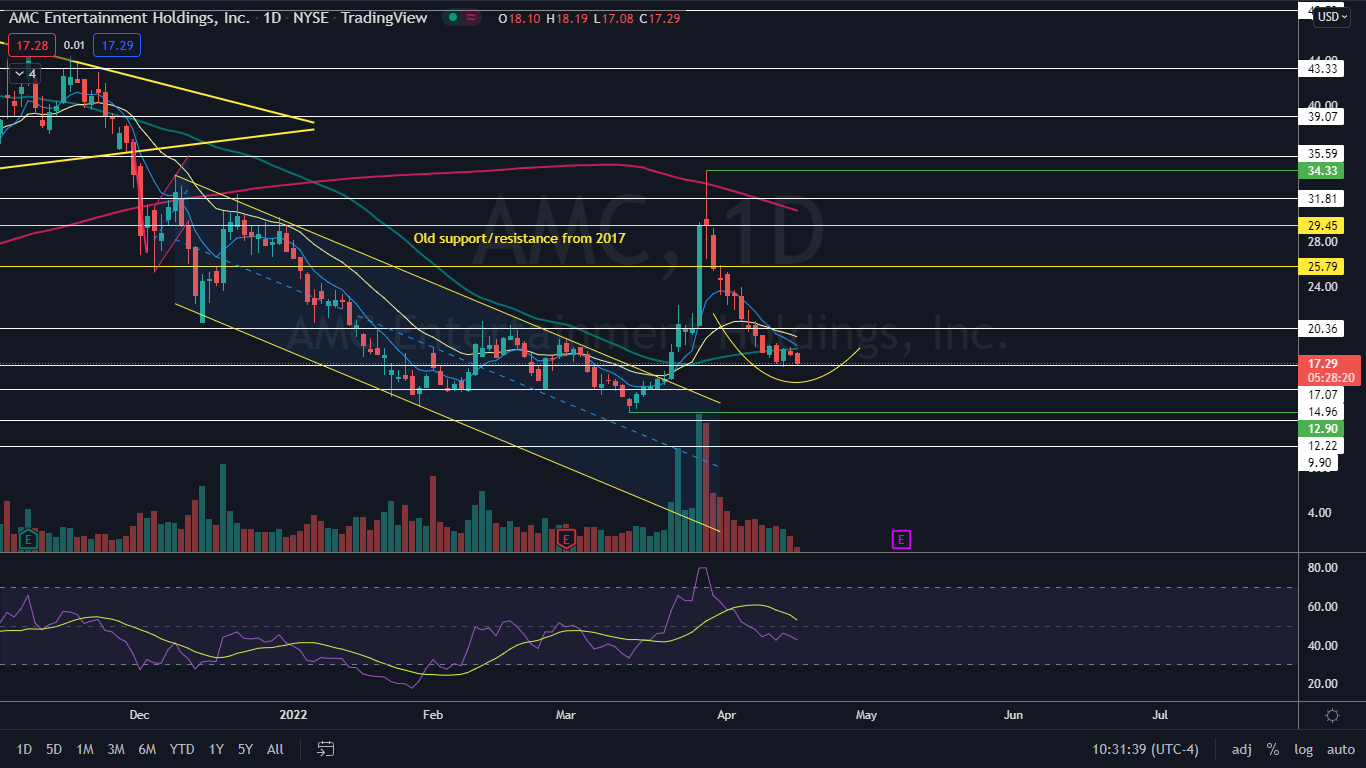
The announcement didn’t boost AMC on Monday, which was trading about 3% lower at press time. The stock has been in a period of consolidation for about the last six trading days after a volatile period caused the stock to surge 117% higher between March 22 and March 30 before retracing about 50% lower.
According to the most recent data, AMC remains a good candidate for a short squeeze. As of March 31, of AMC’s 515.45 million share float, 101.42 million shares, meaning 19.63% of the total float, is held short.
Want direct analysis? Find me in the BZ Pro lounge! Click here for a free trial.
The AMC Chart: After surging up to reach a March 29 high of $34.33, AMC retraced and has spent the last six trading days stuck in a tight range between about the $17 and $20 levels. The retracement, paired with the consolidation may be forming an eventual cup-and-handle pattern on the daily chart because the candlesticks that have printed between March 30 and Monday have created the beginning of an arc formation.
- If AMC is in the middle of forming a cup-and-handle, the stock should continue to rise up before forming into a downward channel prior to reaching the March 29 high-of-day. If AMC falls below support at the $17.07 level, it’s likely the cup-and-handle is negated and the stock will trade in a downtrend.
- On Monday, AMC tested the $17.01 area as support and bounced up slightly. Paired with similar price action on April 13, AMC has formed a bullish double bottom pattern on the daily chart. If the pattern is recognized, bullish traders can watch for higher prices to come over the next few days, which may help to create the cup pattern.
- AMC has had steadily decreasing volume since spiking up over the $30 level, which indicates the stock is running out of both buyers and sellers. Decreasing volume is often followed by a large surge of volume to break a stock out of the sideways pattern and bulls and bearish can watch to see whether bullish or bearish volume enters to gauge future direction.
- AMC has resistance above at $20.36 and $25.79 and support below at $17.07 and $14.96.

© 2025 Benzinga.com. Benzinga does not provide investment advice. All rights reserved.
Trade confidently with insights and alerts from analyst ratings, free reports and breaking news that affects the stocks you care about.