
Zinger Key Points
- Snap has a 52-week high of $83.34 and a 52-week low of $24.32.
- Get Pro-Level Earnings Insights Before the Market Moves
Snap, Inc SNAP is set to print its first-quarter financial results after the markets close on Thursday. Analysts expect Snapchat's parent company to report earnings per share of 14 cents on revenue of $763.29 million for the quarter ending Dec. 31.
Ahead of the earnings print, on Wednesday Citigroup upgraded Snap to Buy and raised its price target to $50.
When Snap printed its fourth-quarter earnings print on Feb. 3, the stock gapped up a whopping 44% and, over the course of that day, and the four days that followed soared an additional 19% higher to reach a Feb. 10 high of $41.97.
For that quarter, Snap reported earnings per share of $4.10 on revenues of $1.3 billion, beating the estimate of an EPS of $3.62 on revenues of $1.2 billion. Global daily active users in the fourth quarter hit 319 million, which represented a 20% year-over-year increase.
Since reaching the high of its last post-earnings run, the stock has been heavily beaten down, plummeting over 31% to reach a low of $28.90 on Thursday, heading into its next earnings event.
From a technical perspective, Snap looks set for at least a bounce but the overall trend points to more downside. Of course, holding a position in a stock over earnings can be akin to gambling because stocks can rise following an earnings beat and fall after reporting a miss.
Want direct analysis? Find me in the BZ Pro lounge! Click here for a free trial.
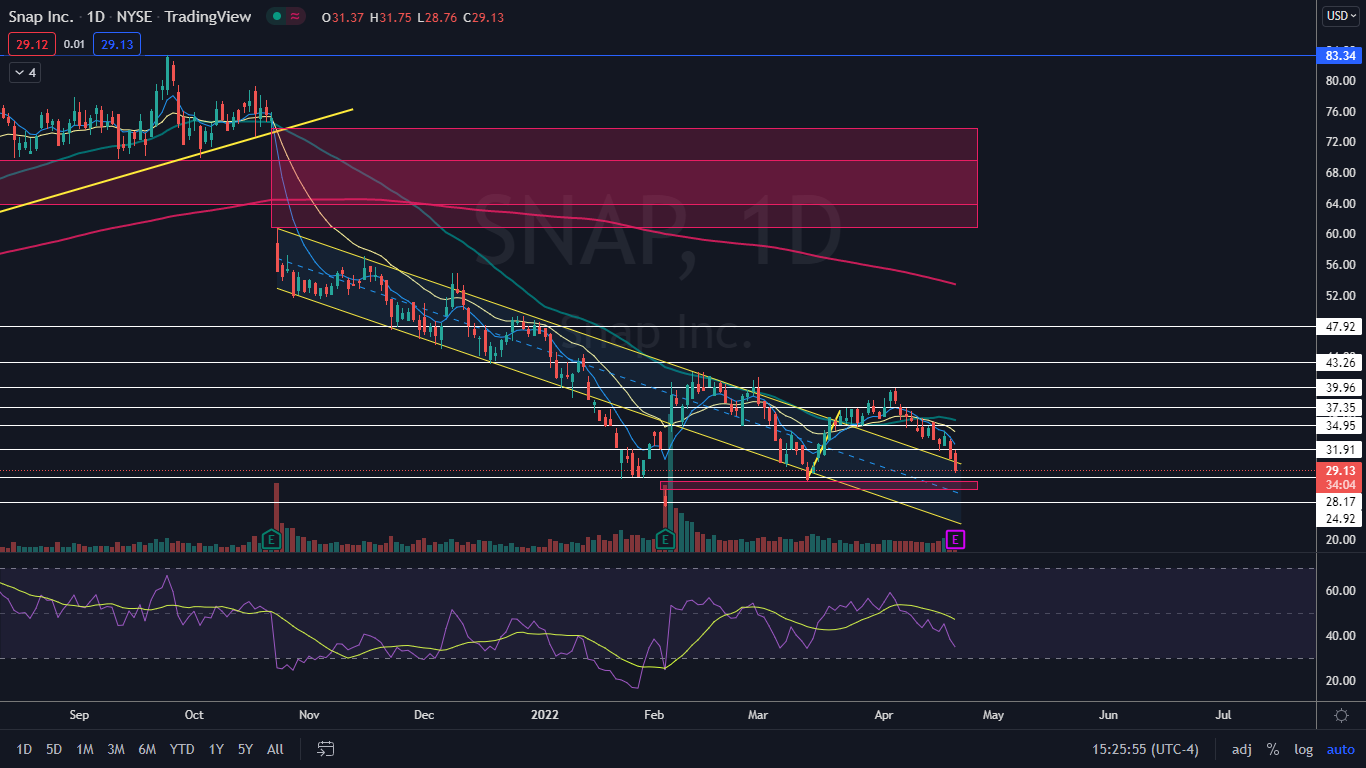
The Snap Chart: Snap has been trading in a consistent downtrend since April 5, when the stock topped out just below the $40 level. Snap’s most recent lower high was printed on April 19 at $34.24 and the most recent confirmed lower low was printed at $31.60 the day prior.
If Snap has a bullish reaction to its earnings print, Thursday’s low-of-day may mark the next lower low but traders and investors will have to wait and see whether it marks the end of the heavy downtrend.
- The stock looks set for at least a bounce soon because Snap’s relative strength index (RSI) is measuring in at about 35%. When a stock’s RSI nears or falls to the 30% level it becomes oversold, which can be a buy signal for technical traders.
- See Also: How to Read Candlestick Charts for Beginners
- If Snap closes the trading session near its low-of-day price, it will print a bearish Marubozu candlestick, which could indicate lower prices will come on Friday. There is a lower gap the stock may be gravitating toward between the $26.49 and $27.67 range.
- There is also a gap above on Snap’s chart between $60.78 and $73.89 that the stock is likely to trade up into at some point in the future, because gaps on charts fill about 90% of the time.
- Snap is trading below the eight-day and 21-day exponential moving averages (EMAs), with the eight-day EMA trending below the 21-day, both of which are bearish indicators. Bullish traders would prefer to see Snap regain the support of both moving averages in order to gain confidence going forward.
- Snap has resistance above at $31.91 and $34.95 and support at $28.17 and $24.92.
© 2025 Benzinga.com. Benzinga does not provide investment advice. All rights reserved.
Trade confidently with insights and alerts from analyst ratings, free reports and breaking news that affects the stocks you care about.

