Zinger Key Points
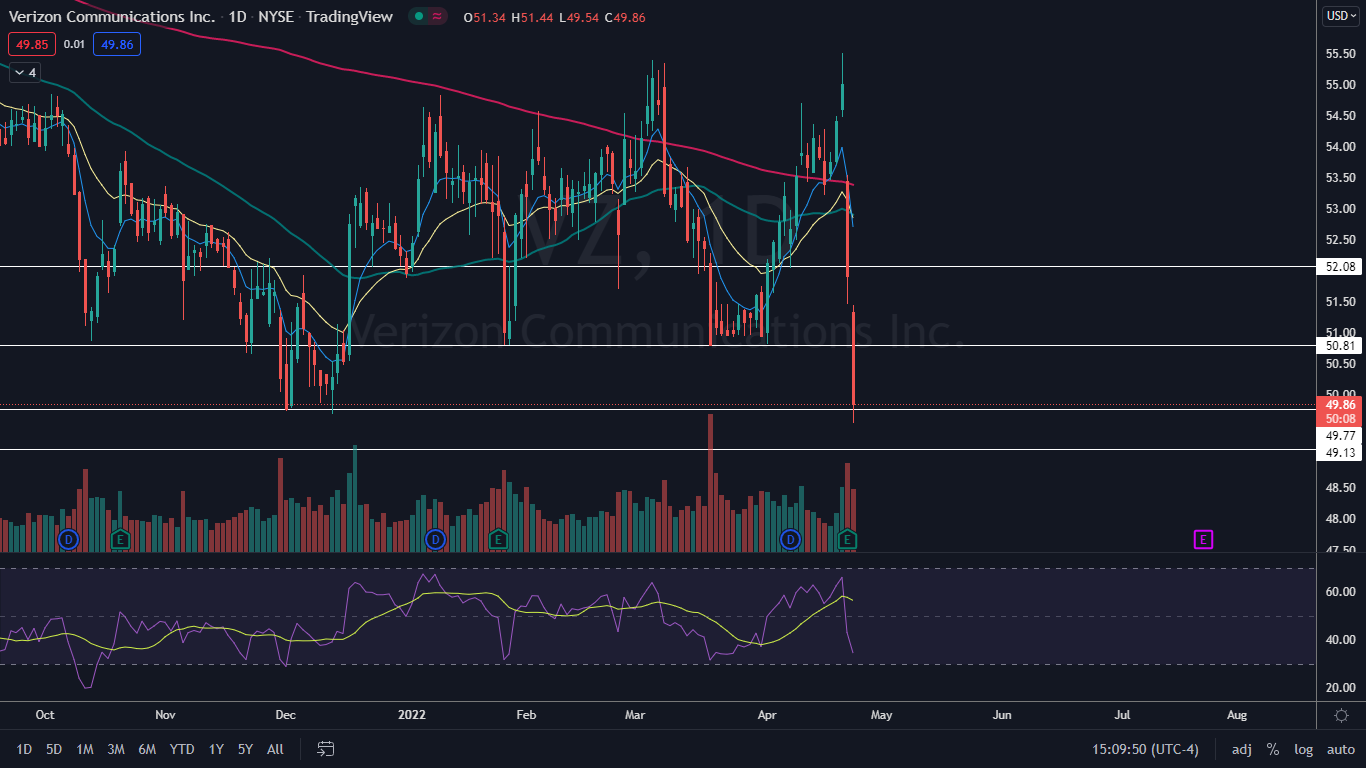
- The last two daily candlesticks on Verizon’s chart are both bearish kicker candlesticks.
- The fall lower was on higher-than-average volume, indicating the bears are currently in control.
- Feel unsure about the market’s next move? Copy trade alerts from Matt Maley—a Wall Street veteran who consistently finds profits in volatile markets. Claim your 7-day free trial now.
Verizon Communications, Inc VZ slid more than 4% lower on Monday after Goldman Sachs downgraded the stock from Buy to Neutral. The fall was in addition to a 5.64% decline on Friday following the release of the company’s first-quarter earnings print.
For that quarter, Verizon reported earnings per share of $1.35, meeting the analyst consensus estimate and sales of $33.6 billion, which beat the analyst consensus estimate of $33.54 billion. The post-earnings slide was likely due to the company lowering its EPS guidance for FY22, which they adjusted to come in at the lower end of the previously stated $5.40-$5.55 range.
The plunge took Verizon to a new 52-week low of $49.54 on Monday, a level which the stock hasn’t visited since March of 2020 when the COVID-19 pandemic first took hold.
Verizon could be in for more downside on Tuesday due to bearish patterns that have developed on the stock’s chart, but a bounce is certain to come in the near-future because stock’s never go straight down in the same way that they never go straight up.
Want direct analysis? Find me in the BZ Pro lounge! Click here for a free trial.
The Verizon Chart: The last two daily candlesticks on Verizon’s chart are both bearish kicker candlesticks, which suggests a third bearish kicker candlestick could form on Tuesday. If one does, Verizon may form a sanku pattern, which is the Japanese term for a three gap down reversal pattern.
- Traders and investors looking to take a position for a bounce may choose to watch for the stock to hit a volume climax, which may take place when Verizon enters into oversold territory with a relative strength index measuring in below 30%. This is likely to happen if the stock continues to fall on Tuesday.
- The fall lower was on higher-than-average volume, which indicates the bears are currently in control. At press time, over 34 million Verizon shares had exchanged hands, compared to the 10-day average of 24.09 million. Eventually the bears will become exhausted and Verizon will enter into a period of consolidation as the stock runs out of sellers.
- If Verizon doesn’t trade lower again on Tuesday, the second most likely scenario is that it will form an inside bar pattern on the daily chart. The pattern will lean bearish because Verizon was trading lower before entering into the formation.
- Verizon has resistance above at $50.81 and $52.08 and support below at $49.77 and $49.13.

Edge Rankings
Price Trend
© 2025 Benzinga.com. Benzinga does not provide investment advice. All rights reserved.
Trade confidently with insights and alerts from analyst ratings, free reports and breaking news that affects the stocks you care about.