Zinger Key Points
- Uber left a gap between $27.75 and $28.85, which is about 90% likely to be filled in the future.
- A rebound is likely to come soon because Uber’s relative strength index is measuring in at about 32%.
- Markets are messy—but the right setups can still deliver triple-digit gains. Join Matt Maley live this Wednesday at 6 PM ET to see how he’s trading it.
Uber Technologies, Inc UBER experienced a high level of volatility after the market close on Tuesday and in the premarket on Wednesday.
On Tuesday, between 4:00 p.m. and 5:15 p.m., Uber plunged over 12% lower in sympathy with Lyft, Inc LYFT, which issued second quarter sales guidance below analyst estimates. Uber then began to recover, soaring up over 15% higher, to reach the $30 level at 7:00 a.m. on Wednesday when it printed its first-quarter results, which caused Uber to plunge over 11% lower before ticking up slightly before the market open.
Uber reported a massive miss, with a loss of $3.04 per share, which came in well below the consensus estimate of a loss of 24 cents per share. The mobile-app-based transportation company posted a top-line beat, however, reporting revenues of $6.85 billion compared to the estimate of $6.09 billion.
Uber has been trading in a long-term downtrend since Feb. 11, 2021, losing over 58% of its value. The sharp drop on Wednesday accelerated the decline, bringing Uber down to new 52-week lows and to prices the stock hasn’t seen since May 2020.
Want direct analysis? Find me in the BZ Pro lounge! Click here for a free trial.
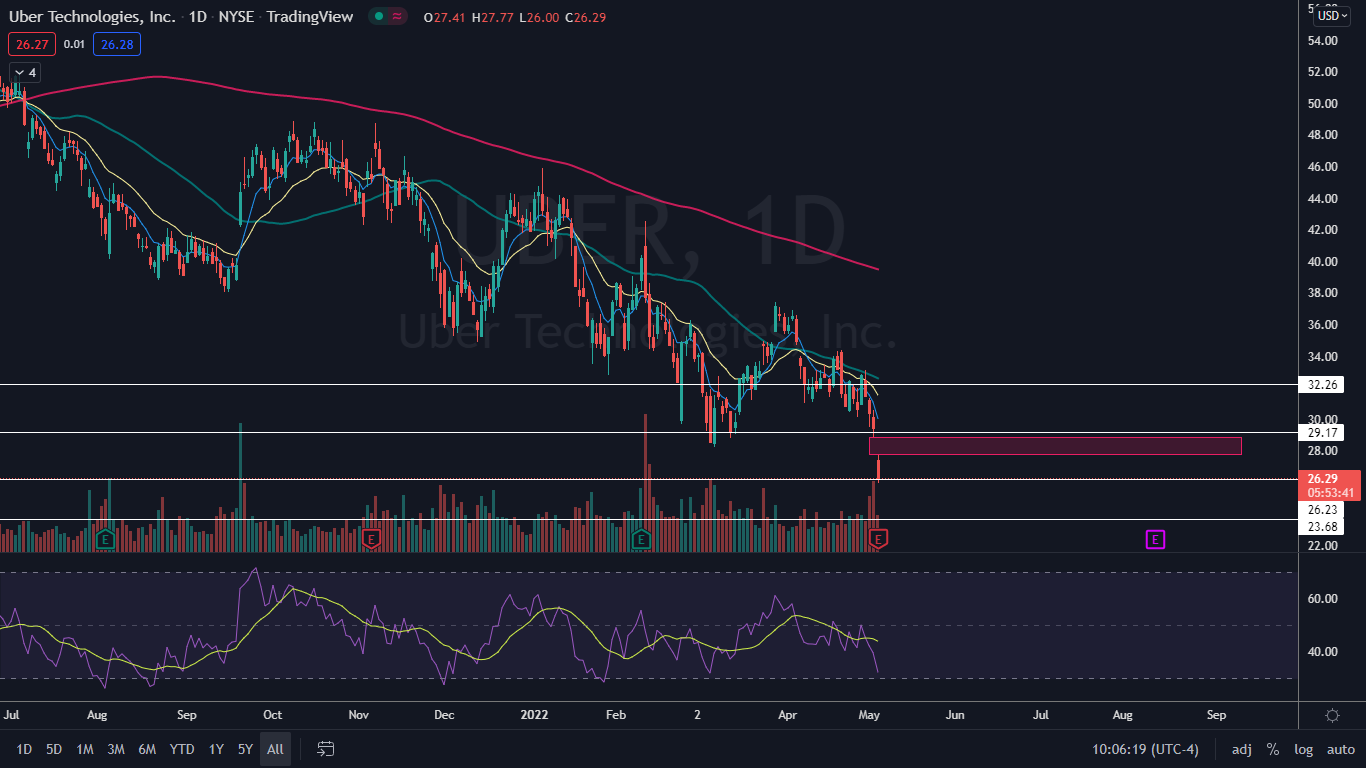
The Uber Chart: Uber gapped down about 7% lower to start the trading day and continued to move lower intraday, falling 11% at one point on Wednesday morning. The decline is a continuation of Uber’s downtrend, with the most recent lower high formed at $33.15 on April 29 and the most recent confirmed lower low printed on April 27 at the $30.16 mark.
- The gap Uber left behind, between $27.75 and $28.85 is about 90% likely to be filled in the future. Bullish traders and investors can watch for the gap to fill when Uber prints its next lower high in the downtrend pattern.
- The rebound is likely to come soon because Uber’s relative strength index (RSI) is measuring in at about 32%. When a stock’s RSI reaches or falls below the 30% level, it becomes oversold, which can be a buy signal for technical traders.
- If Uber closes the trading session near its low-of-day price, it will print a bearish kicker candlestick, which could indicate lower prices will come again on Thursday. If the stock closes the trading day flat or near its high-of-day price, Uber will print a doji or hammer candlestick, respectively, which could indicate a bounce is imminent.
- Uber has resistance above at $29.17 and $32.26 and support below at $26.23 and $23.68.

See Also: Why Uber Shares Are Sliding
Edge Rankings
Price Trend
© 2025 Benzinga.com. Benzinga does not provide investment advice. All rights reserved.
Trade confidently with insights and alerts from analyst ratings, free reports and breaking news that affects the stocks you care about.