

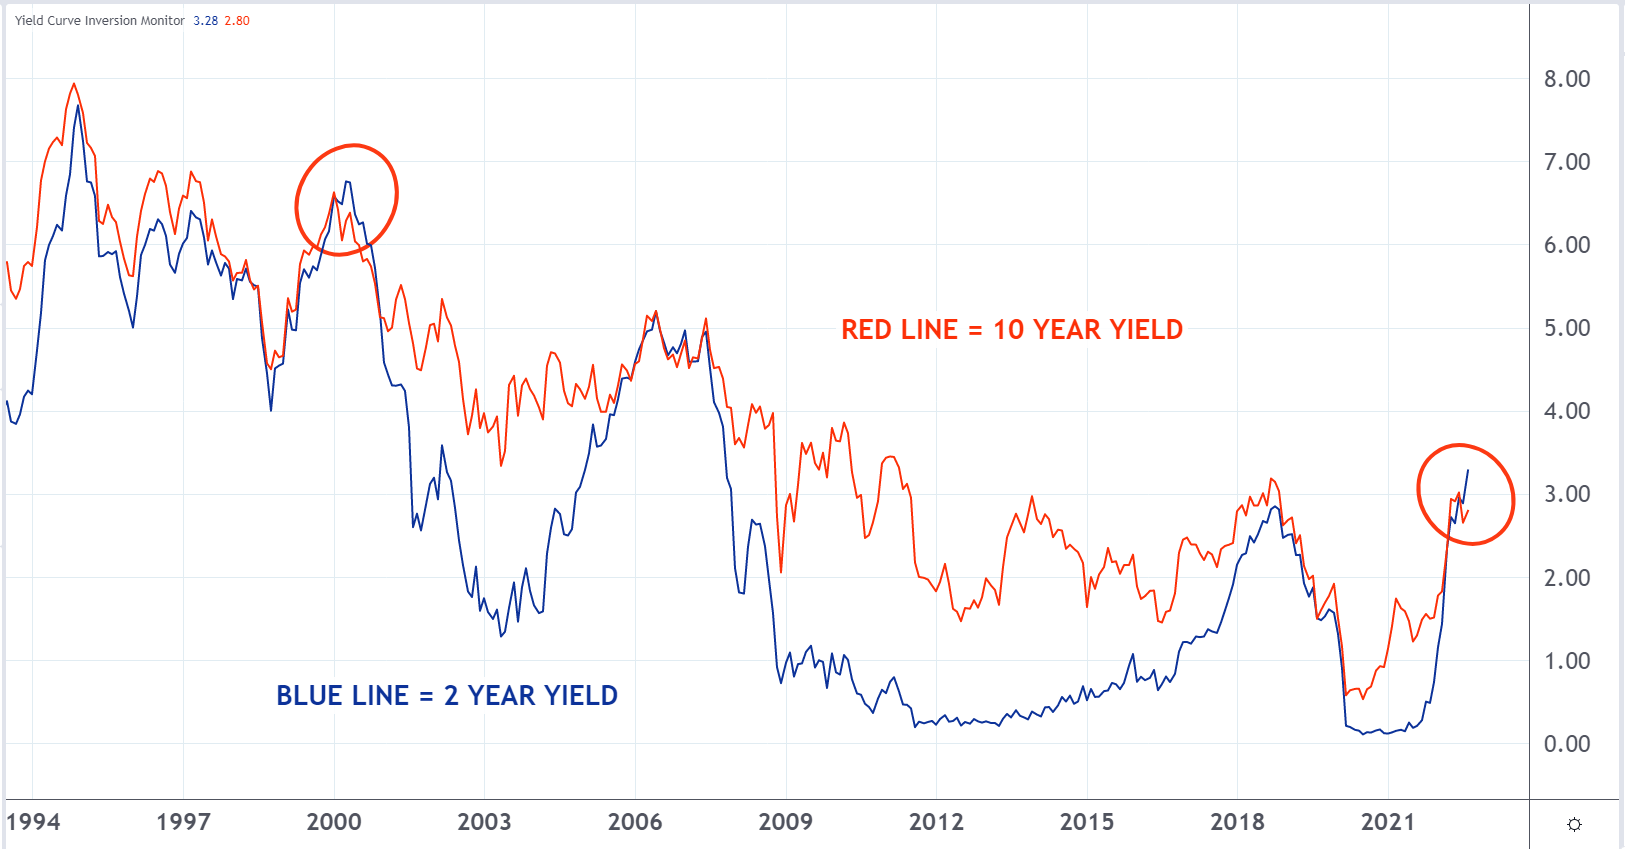
The yield curve is the most inverted that it has been since 2000. This could be a sign of recession. It has been an accurate indicator in the past.
The amount of a dividend that a bond pays is fixed. So as the price of the bond fluctuates, so will the percentage yield.
Related Link: US Treasury Yield Remains Inverted After Solid Jobs Number: Will The Economy Tip Into A Recession?
For example, if a bond is issued at $100 and pays a $9 annual dividend, it would be a 9% yield. Now suppose the price of the bond falls to $90. The yield would be 10%. And if the bond went to $110, the yield would be 8.1%.
Typically, the longer the maturity of the bond, the higher the yield. But this isn’t the case with a yield curve inversion. Now the two-year rate is higher than the 10-year yield.
This occurs because bond traders aggressively sell short-term bonds and buy long-term ones. They think the short-run economic prospects aren’t good, but the longer-term picture looks OK.
Their aggressive selling of short-term bonds pushes their yields higher. The aggressive buying of long-term bonds pulls their rates lower. When these two rates cross, they are said to be inverted.
Historically, these conditions have been a good predictor of an upcoming recession. It may happen again.
To learn more about trading, check out the new Benzinga Trading School.
© 2025 Benzinga.com. Benzinga does not provide investment advice. All rights reserved.
Trade confidently with insights and alerts from analyst ratings, free reports and breaking news that affects the stocks you care about.

