Zinger Key Points
- Apple stock shows strong bullish trends, trading above key moving averages, with potential for further upside.
- Technical indicators like MACD and Bollinger Bands suggest bullishness, but RSI indicates overbought conditions.
- Get access to your new suite of high-powered trading tools, including real-time stock ratings, insider trades, and government trading signals.
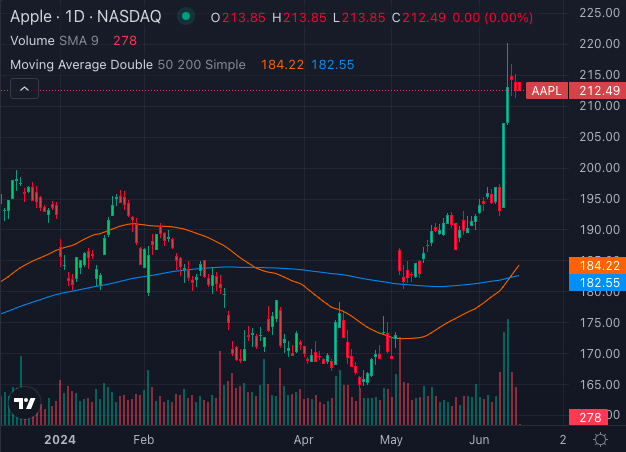
Apple Inc (NASDAQ) has been on a solid uptrend, with its stock up 15.52% over the past year, 10.37% year-to-date, and a whopping 333% over the last 5 years. The stock just triggered a Golden Cross signal, validating the surge and suggesting more upside ahead.

The 50-day simple moving average (SMA) (orange line in the chart above) for Apple stock has crossed over the 200-day SMA (blue line in the chart above), setting the stage for a bullish uptrend from here.
Golden Cross Triggers A Strong Bullish Trend
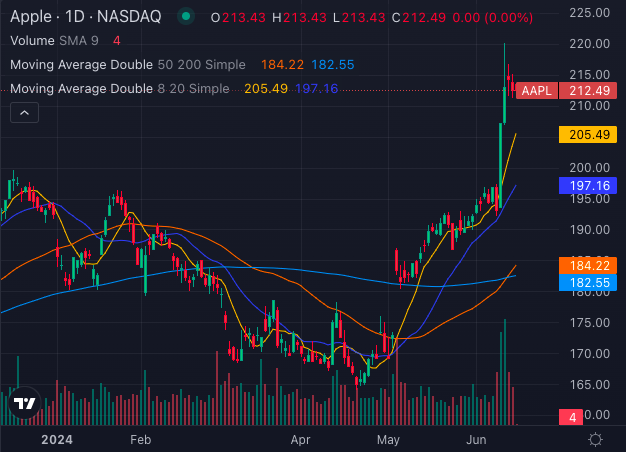
From a technical analysis perspective, Apple’s stock has shown remarkable strength, supported by its impressive performance metrics. The stock is currently trading well above its 5, 20, and 50-day exponential moving averages, indicating a strong bullish trend.

This trend is further corroborated by the stock price of $212.49 being significantly higher than the 8-day simple moving average of $205.49, which is a clear bullish signal. Additionally, the stock price is comfortably above the 20-day SMA of $197.16 and the 50-day SMA of $184.22, both of which signal bullishness based on technical analysis. The 200-day simple moving average of $182.55 further supports this bullish sentiment.

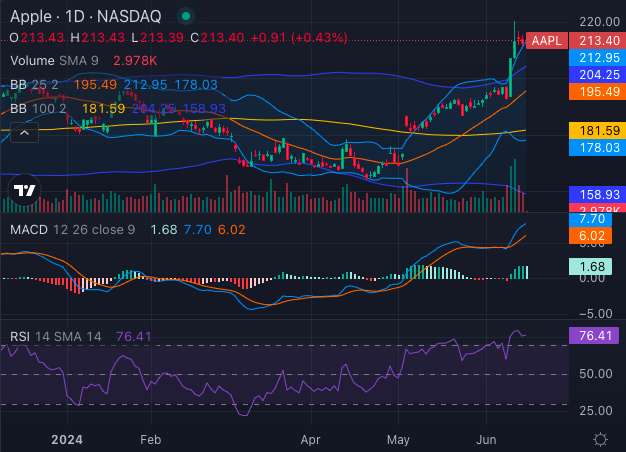
The Moving Average Convergence Divergence (MACD) indicator is at 7.70, suggesting a bullish signal. However, it’s worth noting that the Relative Strength Index (RSI) is currently at 76.41, indicating that Apple shares may be overbought.
The Bollinger Bands (25) and Bollinger Bands (100) for Apple stock are ($178.03 – $212.95) and ($158.93 – $204.25) respectively, both suggesting bullishness. Overall, the technical indicators paint a positive picture for Apple, with strong bullish momentum and potential for further upside, although investors should remain cautious of the overbought conditions indicated by the RSI.
Solid Fundamentals Support Long-Term Bullishness
Apple’s fundamentals remain solid. The recent Worldwide Developers Conference (WWDC24) further fueled optimism, highlighting a potential multi-year hardware upgrade cycle and growth in Services revenue.
Apple’s introduction of iOS18 and Apple Intelligence at WWDC24 could catalyze a multi-year upgrade cycle across their vast installed base, consisting of billions of devices. This strategic move should set the stage for continued innovation and revenue growth.
Financially, Apple is in a strong position, boasting $67.15 billion in cash and short-term investments, with an additional $95.19 billion in marketable securities. The company has generated $381.62 billion in revenue over the trailing 12 months (TTM), with a solid gross profit of $173.97 billion at a margin of 45.59%. Operating income stands at $118.24 billion, with a 30.98% margin, while net income is $100.29 billion, showcasing a 26.31% profit margin.
Apple’s strong profitability, with over $100 billion annually in net income, EBITDA, and free cash flow, enables it to sustain dividend payments, share buybacks, and future investments without overleveraging. This financial strength, coupled with ongoing innovations like the AI upgrades announced at WWDC24, further solidify Apple’s position as a dominant player in the tech industry.
Apple’s performance, both in terms of product innovation and financial strength, bodes well for its future growth potential. That, coupled with the bullish sentiments surrounding its stock and the Golden Cross validating the surge expected ahead, positions it as a compelling investment opportunity for investors seeking exposure to the tech sector.
Photo: Shutterstock
© 2025 Benzinga.com. Benzinga does not provide investment advice. All rights reserved.
Trade confidently with insights and alerts from analyst ratings, free reports and breaking news that affects the stocks you care about.