
Zinger Key Points
- American Airlines' stock down 32.22% over the past year, -18.16% YTD, with bearish Death Cross signal.
- Failed strategies and leadership changes compound bearish technical indicators, signaling potential for further downside.
- Get 5 stock picks identified before their biggest breakouts, identified by the same system that spotted Insmed, Sprouts, and Uber before their 20%+ gains.
American Airlines Group Inc. (NASDAQ) has been in a downward spiral, with its stock plummeting 32.22% over the past year and 18.16% year-to-date.
The recent departure of Chief Commercial Officer Vasu Raja and a downward revision of second-quarter earnings have further dampened investor sentiment, culminating in a bearish Death Cross signal that indicates potential for more downside ahead.
Bearish Fundamentals Weighing On American Airlines
American Airlines has revised its second-quarter earnings per share (EPS) forecast to $1-$1.15, down from the previous target of $1.15-$1.45. This downward revision comes as the airline anticipates a 5%-6% decline in unit revenues compared to the prior year’s expected 1%-3% decline.
The inability to pass on costs to consumers and ineffective revenue management strategies have severely impacted American Airlines’ profitability.
The departure of Vasu Raja, who spearheaded a failed initiative to reduce reliance on third-party booking sites, has added to the uncertainty. Stephen Johnson, vice chairman and chief strategy officer, will temporarily take over Raja’s responsibilities while leading the search for a new chief commercial officer. This leadership change comes at a critical time as American Airlines grapples with competitive pressures and strategic missteps.
Strategic Misalignment and Competitive Pressures
American Airlines’ focus on smaller cities and the Sun Belt region has not provided the competitive advantage it anticipated. The overemphasis on the New Distribution Capability (NDC) system to cut costs has backfired, leaving the airline with a subpar revenue and sales optimization system.
Additionally, the airline’s capacity deployment strategy has failed to yield key differentiators, further eroding its market position.
Related: American Airlines CEO Admits Mistake, Vows To Win Back Clients
Technical Indicators Signal Strong Bearish Trend
From a technical analysis perspective, American Airlines’ stock is exhibiting strong bearish signals:
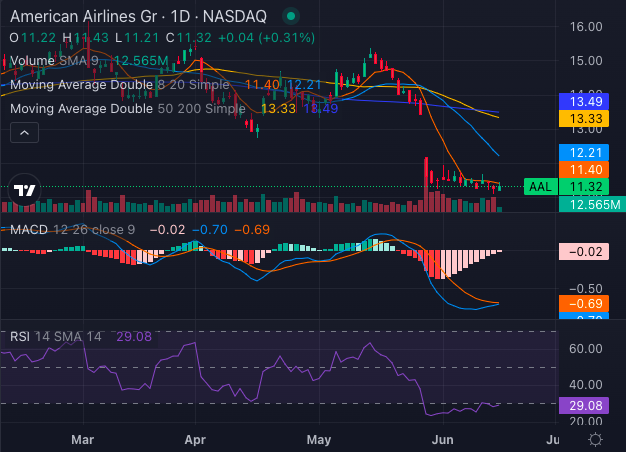
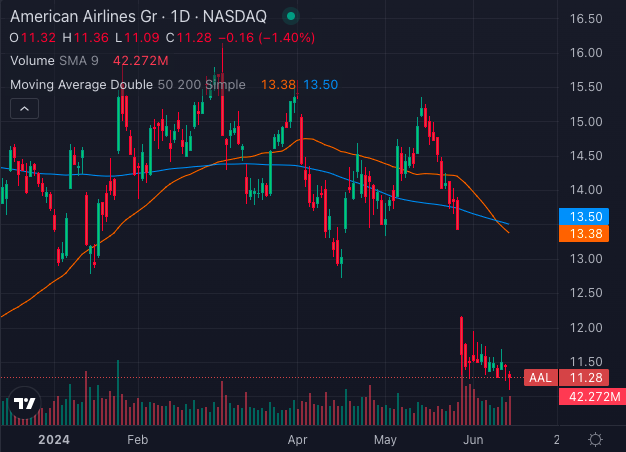
- The stock price of $11.32 is below its 5-day, 20-day, and 50-day exponential moving averages, indicating persistent bearish momentum.
- The 8-day simple moving average is $11.40, the 20-day SMA is $12.21 and the 50-day SMA is $13.33, all suggesting a bearish signal.
- The 200-day simple moving average stands at $13.49, with the current stock price significantly below this level, further affirming the bearish trend.
- The Moving Average Convergence Divergence (MACD) indicator is at -0.70, suggesting bearish momentum.
- The Relative Strength Index (RSI) is at 29.08, indicating that the stock is oversold but still susceptible to further declines.
American Airlines’ stock is facing significant headwinds both fundamentally and technically. The bearish Death Cross signal underscores the challenges ahead, and with ongoing strategic and operational issues, investors should brace for potential further declines in American Airlines’ stock price.
Read Next: Turbulent Outlook For American Airlines: Analysts Cut Forecasts As Competitive Pressures Mount
Photo: Shutterstock
© 2025 Benzinga.com. Benzinga does not provide investment advice. All rights reserved.
Trade confidently with insights and alerts from analyst ratings, free reports and breaking news that affects the stocks you care about.

