Zinger Key Points
- A bearish pattern suggests the stock may be about to move lower.
- Thursday’s closing price of Nvidia was lower than the opening price on Wednesday.
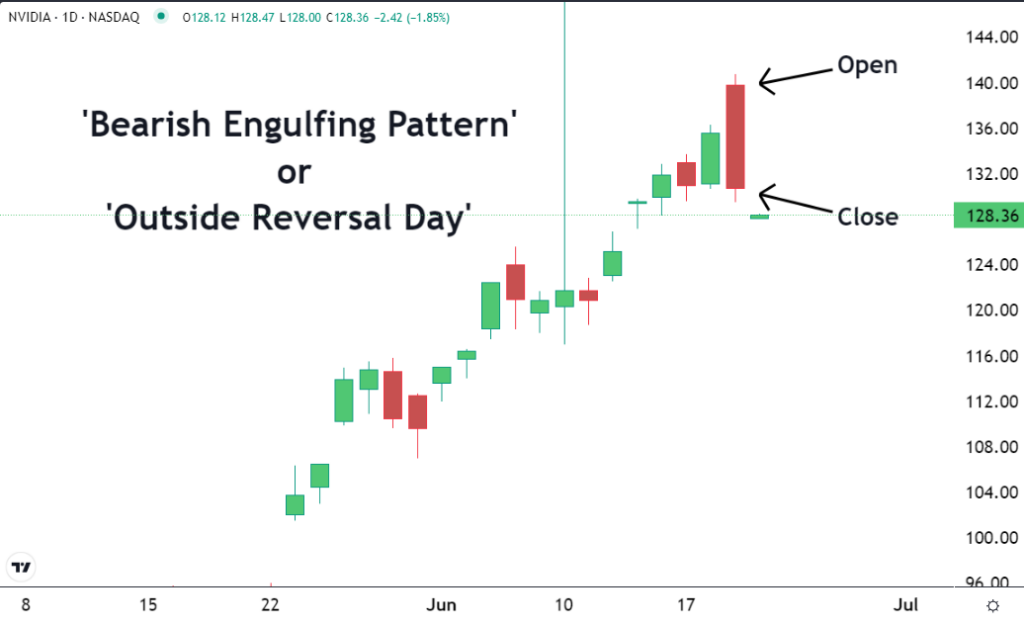
A classic bearish engulfing pattern, also called a bearish outside day, has formed on the NVIDIA Corp NVDA chart.
The pattern suggests the stock may be about to move lower.
Reversal patterns are an illustration of a change of leadership in the market. When it's trending higher the bulls are in charge. When it's heading lower it's the bears who are in control.

When this leadership changes, the price action can appear on the chart as a reversal pattern.
If the change is slow and takes place over an extended time, it may show up on a chart as a rounded pattern. If it is a sharp reversal that takes place over just a few time periods, it could appear as a “V” pattern.
Read Next: What’s Going On With Nvidia Stock Friday?
And if the reversal takes place in just one time period, it can show up as a Bearish engulfing pattern.
Shares of Nvidia have been trending higher since the end of May. Yesterday, in the morning it looked like this trend would continue. The shares opened at a higher price than Wednesday's close.
But then the bears overpowered the bulls and pushed them much lower. Importantly, Thursday's closing price was lower than the opening price on Wednesday.
This dynamic of this action is what creates the pattern on the chart.
There tends to be short-term support at recent opening and closing prices. The fact that Nvidia could blow right through them indicates that the sellers are aggressive and want to exit their positions regardless of cost.
Time will tell, but this could be the start of a new downtrend.
This image was created using artificial intelligence MidJourney.
© 2025 Benzinga.com. Benzinga does not provide investment advice. All rights reserved.
Trade confidently with insights and alerts from analyst ratings, free reports and breaking news that affects the stocks you care about.