Zinger Key Points
- A number of Classic Bearish Patterns have formed on the chart on Micron Technology.
- This means there's a good chance the price moves lower.
- China’s new tariffs just reignited the same market patterns that led to triple- and quadruple-digit wins for Matt Maley. Get the next trade alert free.
Classic technical analysis patterns have appeared on the chart of Micron Technology, Inc. MU. That's why our team of technical analysts have made it our “Stock of the Day.”
Technical Analysis has a bad reputation.
But unfortunately, it is well-deserved. Most technical analysts just don't get it. They mindlessly look at charts and repeat what others have told them. They don't seem to know what it is that they are supposed to be looking at.
But if understood and applied correctly, technical analysis is simply a graphic illustration of the supply and demand dynamics in a market.
For example, when the leadership of a market changes, from bulls to bears or bears to bulls, the market is about to reverse and trend in the other direction it can show up on the chart as a “reversal pattern.”
When the current trend takes a break before continuing, the action can show up on the chart as a “continuation pattern.” Money can be made here too from being on the right side.
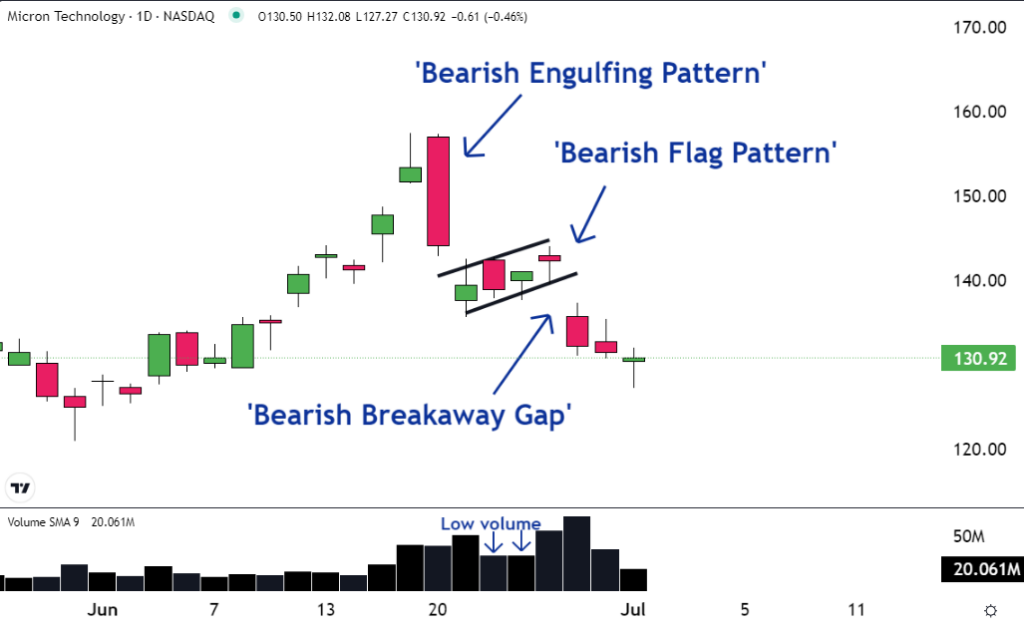
As you can see on the chart of Micron, there is a Bearish Engulfing Pattern. There has also been some interesting activity in the options market.
This pattern illustrates bearish dynamics. Micron looked to keep moving higher. The opening price was higher than the previous day's close.
But before the market closed, the sellers took over and pushed the price way lower. Even lower than the prior open.

And then another pattern showed up ... It was a Bearish Flag.
This pattern illustrates how the people who are responsible for the move lower decided to take a break. They think if they stop selling for a few days, the price could be higher and they could finish their orders at a better price.
As a result, there is a break of the trend with low volume as they sit on the sidelines. It shows up on the chart as a ‘flag’ as the shares drift higher.
The third pattern is a bearish Breakaway Gap. It forms on a chart when sellers are so aggressive and so ready to get out of their positions that don't care about the price.
They just want out.
As a result, the opening price is significantly lower than the prior day’s close. This action manifests itself as a gap or levels where the shares didn't trade on the chart.
It's unfortunate that technical analysis has a bad rap because it shouldn't. If applied and understood correctly, technical analysis is an illustration of supply and demand.
Savvy traders can use this analysis to profit.
The three illustrations of bearish patterns on the Micron chart would suggest this new downtrend forming may be just getting started. There's a good chance the shares move lower.
Read Next:
• 5 Biggest Winners, 5 Biggest Losers From Dow Jones Industrial Average In First Half 2024
Photo: NPS_87 on Shutterstock
Edge Rankings
Price Trend
© 2025 Benzinga.com. Benzinga does not provide investment advice. All rights reserved.
Trade confidently with insights and alerts from analyst ratings, free reports and breaking news that affects the stocks you care about.