


Zinger Key Points
- Kraft Heinz forms a death cross, signaling prolonged bearish momentum and potential further declines.
- Multiple technical indicators flash sell signals, reinforcing the bearish outlook for Kraft Heinz stock.
- Feel unsure about the market’s next move? Copy trade alerts from Matt Maley—a Wall Street veteran who consistently finds profits in volatile markets. Claim your 7-day free trial now.
Kraft Heinz Co KHC is serving up a bearish entrée to investors as its stock takes a nosedive into the dreaded death cross territory.
Down 11.03% over the past year and a steep 13.85% year-to-date, the iconic food giant's stock is sending strong sell signals across various technical indicators.
At the current share price of $31.86, Kraft Heinz is underperforming its key moving averages. The 5, 20 and 50-day exponential moving averages all hover above the stock price, reflecting a strongly bearish trend and indicating sustained selling pressure.
Here's the scoop on why analysts are waving the red flag:
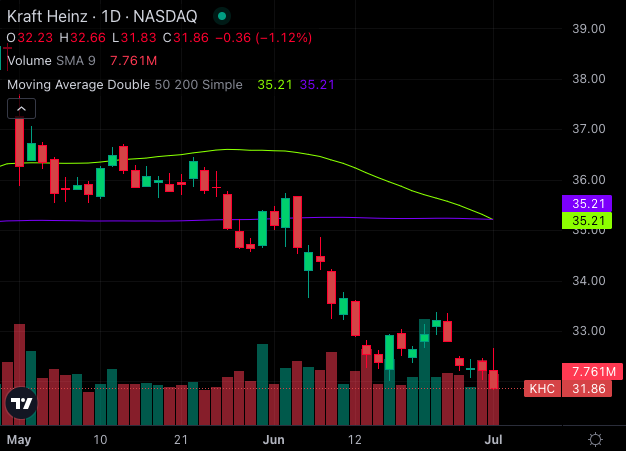
Chart created using Benzinga Pro
The Death Cross: A Bearish Signal for Kraft Heinz
Kraft Heinz has recently formed a death cross, a bearish technical pattern that occurs when the stock’s short-term moving average crosses below its long-term moving average.
In this case, the stock’s 50-day simple moving average has crossed below its 200-day simple moving average, a signal that typically forecasts prolonged downward momentum. This pattern underscores the ongoing weakness in KHC’s stock performance, reinforcing the bearish outlook suggested by other technical indicators.
Investors often interpret the death cross as a clear sell signal, anticipating further declines as the market sentiment turns increasingly negative.
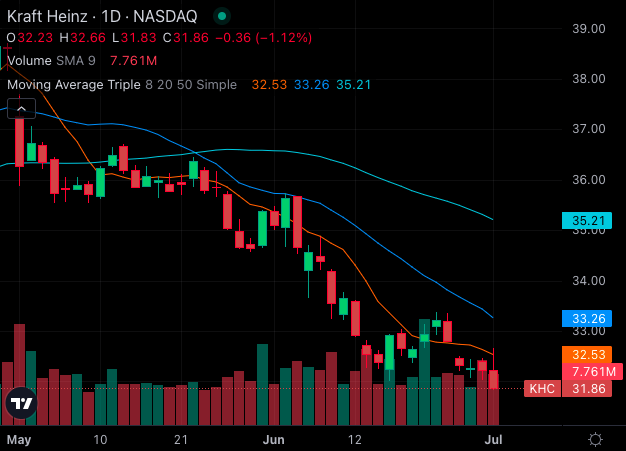
Chart created using Benzinga Pro
- Simple Moving Averages: The stock price of $31.86 is well below its 8-day SMA of $32.53, 20-day SMA of $33.26 and 50-day SMA of $35.21. The 200-day SMA also stands tall at $35.21, reinforcing the bearish outlook.
- MACD Indicator: The Moving Average Convergence Divergence (MACD) indicator for Kraft Heinz sits at -0.85. This negative reading underscores the bearish sentiment, as the MACD remains below the signal line.
- RSI and Bollinger Bands: With a Relative Strength Index (RSI) of 29.29, Kraft Heinz is officially in oversold territory. The Bollinger Bands add to the gloom, with the 25-day range at $31.22 – $36.05 suggesting further downside.
Read Also: Peering Into Kraft Heinz’s Recent Short Interest
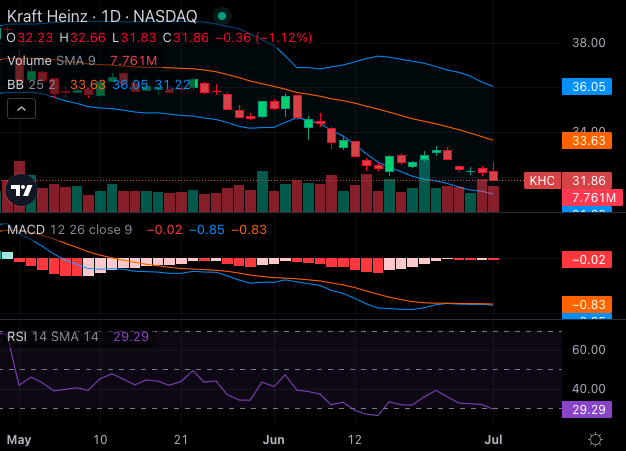
Chart created using Benzinga Pro
The combined weight of these indicators paints a grim picture for Kraft Heinz stock. The stock is not only struggling to stay above key moving averages but also grappling with persistent selling pressure. The bearish momentum is likely to continue, with the death cross signaling a potential for more declines ahead.
Kraft Heinz's current technical setup is more sour than sweet. As the stock flounders below crucial moving averages and key indicators signal a sell, the death cross could be the final straw pushing Kraft Heinz stock further into bearish territory.
Read Next:
Edge Rankings
Price Trend
© 2025 Benzinga.com. Benzinga does not provide investment advice. All rights reserved.
Trade confidently with insights and alerts from analyst ratings, free reports and breaking news that affects the stocks you care about.

