


Zinger Key Points
- AT&T stock reaches a 52-week high of $19.32, indicating strong bullish momentum.
- Key technical indicators suggest continued upward momentum for AT&T, despite slight selling pressure.
- Don't face extreme market conditions unprepared. Get the professional edge with Benzinga Pro's exclusive alerts, news advantage, and volatility tools at 60% off today.
AT&T Inc T soared to a new 52-week high of $19.32 during day trading on July 1, showcasing a robust upward trajectory.
The stock has climbed an impressive 17.74% over the past year and is up 13.11% year-to-date, signaling a strong bullish trend.
With the share price consistently above its key moving averages, AT&T is riding high, though a slight selling pressure is being observed. See below.
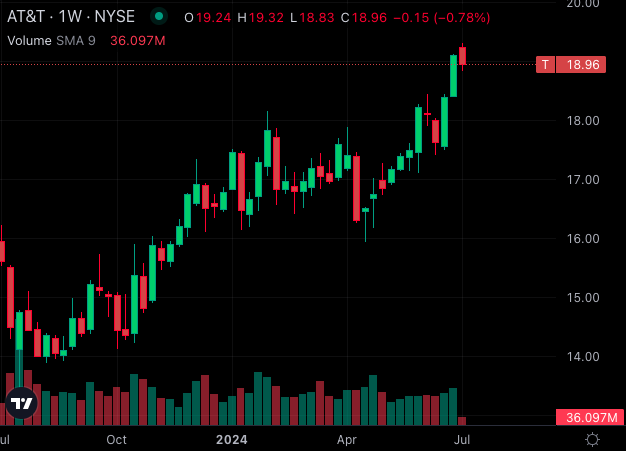
Chart created using Benzinga Pro
Bullish Signals Across the Board
At a current share price of $18.96, AT&T is comfortably above its 5, 20 and 50-day exponential moving averages, reinforcing the bullish sentiment.
Here's a closer look at the technical indicators lighting up with bullish signals:
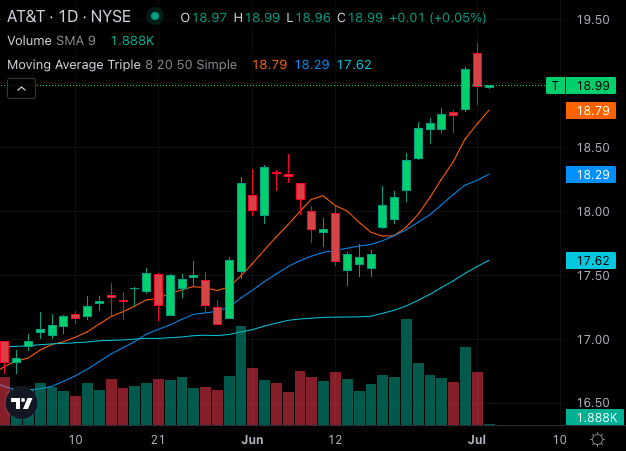
Chart created using Benzinga Pro
- Simple Moving Averages: AT&T’s share price of $18.99 is above its 8-day SMA of $18.79, 20-day SMA of $18.29 and 50-day SMA of $17.62. The 200-day SMA, standing at $16.66, further solidifies the bullish stance. These moving averages collectively indicate continued upward momentum.
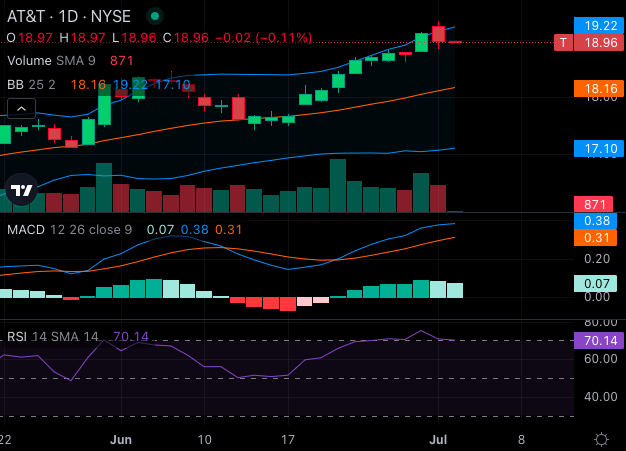
- MACD Indicator: The Moving Average Convergence Divergence (MACD) indicator for AT&T is at 0.38, a positive reading that underscores the bullish sentiment. This suggests that the stock is in a healthy uptrend, with the MACD line staying above the signal line.
- RSI and Bollinger Bands: The Relative Strength Index (RSI) for AT&T is at 70.14, indicating that the stock is overbought. Despite this, the Bollinger Bands provide additional bullish signals. The 25-day range of $17.10 – $19.22 suggests that the stock is poised for further gains.
Read Also: Eli Lilly Soars To 52-Week High: Can The Momentum Continue?
52-Week High: A Bullish Milestone
The achievement of a new 52-week high at $19.32 is a significant milestone for AT&T. This high is a technical affirmation of the stock's strength. It indicates strong investor confidence and could attract more buying interest, potentially driving the stock price higher.
Overall, AT&T's technical setup is overwhelmingly bullish. The stock’s performance above key moving averages, positive MACD reading and favorable Bollinger Bands all point towards a continued uptrend. However, with the RSI indicating overbought conditions, investors should remain cautious of potential short-term pullbacks.
Nonetheless, the new 52-week high underscores AT&T’s solid momentum and bullish outlook.
Read Next:
Image: Unsplash
Edge Rankings
Price Trend
© 2025 Benzinga.com. Benzinga does not provide investment advice. All rights reserved.
Trade confidently with insights and alerts from analyst ratings, free reports and breaking news that affects the stocks you care about.

