Zinger Key Points
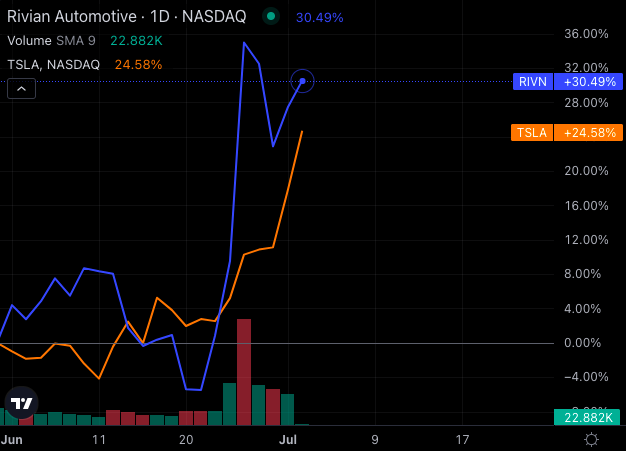
- Rivian's stock surged 26% in the past month, outperforming Tesla's 16% rise.
- Strong technical indicators and a $1 billion Volkswagen investment fuel Rivian's bullish trend.
Rivian Automotive Inc RIVN has been on a tear, with its stock price surging over 30% in the past month. This impressive performance outshone Tesla stock, which rose just over 25% during the same period.

Chart created using Benzinga Pro
Several factors contributed to Rivian’s bullish trend, including strong production figures and a significant investment from Volkswagen.
- Rivian released its second-quarter production figures, and the numbers were strong. The company produced 9,612 vehicles at its manufacturing facility in Normal, Illinois, and delivered 13,790 vehicles during the same period. These results were in line with Rivian’s expectations, boosting investor confidence.
- A significant investment from Volkswagen also bolstered Rivian’s recent stock performance. The German automaker announced a joint venture with Rivian to develop software-defined vehicle platforms for future electric vehicles. Volkswagen’s initial investment of $1 billion, with potential increases up to $4 billion by 2026, strengthened investor confidence in Rivian’s future prospects.
Bullish Technical Indicators
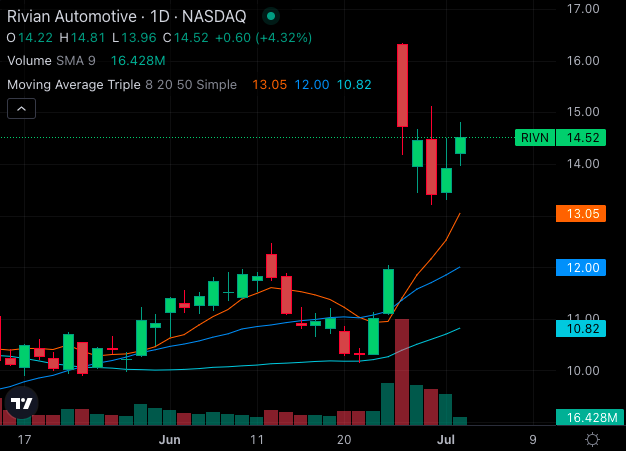
Rivian’s stock is currently exhibiting a strongly bullish trend, with the share price comfortably above its short- and medium-term moving averages. Several technical indicators are flashing bullish signals for Rivian, reinforcing its strong market position.

Chart created using Benzinga Pro
Here are the key technical indicators:
- 8-Day Simple Moving Average (SMA): Rivian’s share price is $14.52, while the 8-day SMA is $13.05, indicating a bullish signal.
- 20-Day SMA: The stock price is trading well above the 20-day SMA of $12, reinforcing the short-term bullish sentiment.
- 50-Day SMA: Rivian’s 50-day SMA stands at $10.82, way below the stock price at $14.52, confirming the bullish signal.

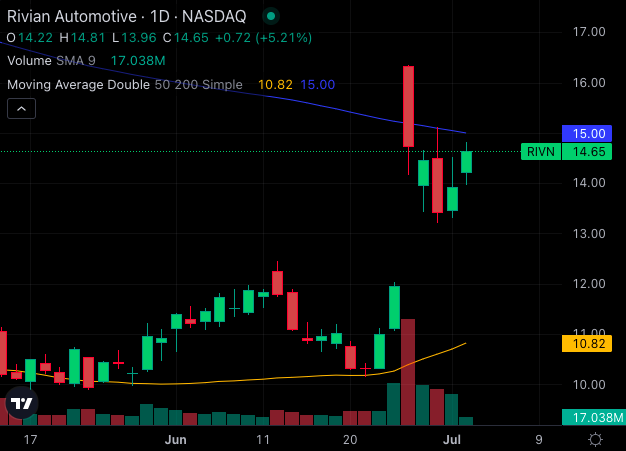
Chart created using Benzinga Pro
- 200-Day SMA: The 200-day SMA is $15, slightly above the current stock price, signaling long-term bearishness. However, the shorter-term averages dominate the bullish sentiment.

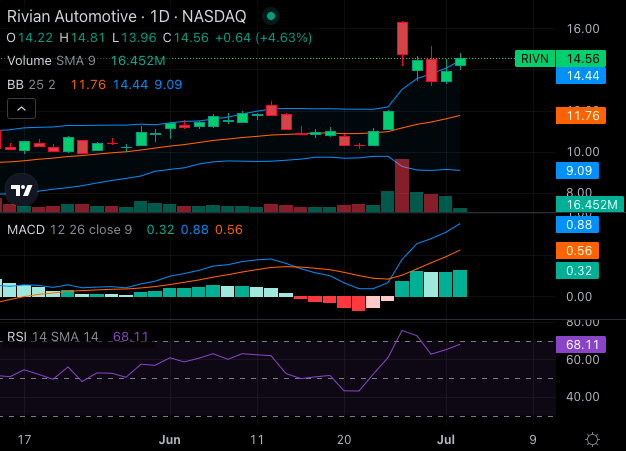
Chart created using Benzinga Pro
MACD and RSI Indicators
- MACD: The Moving Average Convergence Divergence (MACD) indicator is at 0.88, suggesting a bullish trend for Rivian stock.
- RSI: The Relative Strength Index (RSI) is 68.11, indicating that Rivian is approaching overbought territory, but still within a bullish range.
- Bollinger Bands: The 25-Day Bollinger Bands range from $9.09 to $14.44, with the current price trading in the upper, bullish band.
Rivian’s stock is currently riding a bullish wave, with strong technical indicators and strategic partnerships driving its performance. As Rivian continues to outperform Tesla and attract major investments, the company appears well-positioned for future growth.
Read Next:
Photo: Rivian R1T truck, by Tada Images on Shutterstock
© 2025 Benzinga.com. Benzinga does not provide investment advice. All rights reserved.
Trade confidently with insights and alerts from analyst ratings, free reports and breaking news that affects the stocks you care about.