


Zinger Key Points
- Tesla surges 22.74% in 5 days, hitting multiple bullish technical indicators.
- Despite analyst caution, technicals suggest Tesla’s bullish momentum could continue.
- Feel unsure about the market’s next move? Copy trade alerts from Matt Maley—a Wall Street veteran who consistently finds profits in volatile markets. Claim your 7-day free trial now.
Tesla Inc. TSLA stock has been on a tear lately, surging 22.74% over the last five trading days and climbing 45.49% in the past month.
Despite being up only 1.22% year-to-date, the stock remains down 10.96% over the past year. The recent rally has put Tesla in the spotlight, prompting investors to question whether there's more room for the stock to run.
Tesla Analysts See Downside, Despite Bullish Momentum
The three most recent analyst ratings from TD Cowen, Truist Securities, and Guggenheim, all released on July 3 present a stark contrast to the stock’s performance. With an average price target of $158.67, these analysts see a potential downside of 36.41% for Tesla.
This cautious stance, however, hasn’t deterred the bullish sentiment driven by technical indicators.
Bullish Signals Abound For Tesla Stock
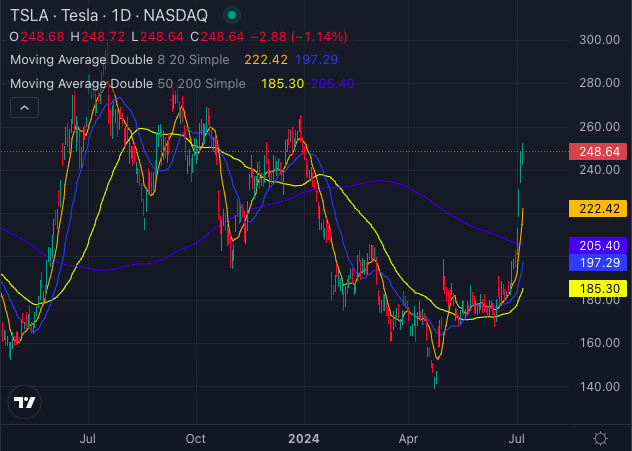
Chart created using Benzinga Pro
Tesla’s current price of $248.64 places it above several key moving averages:
- 8-day SMA: $222.42 (Bullish)
- 20-day SMA: $197.29 (Bullish)
- 50-day SMA: $185.30 (Bullish)
- 200-day SMA: $205.40 (Bullish)
These bullish signals indicate strong buying pressure and a potential continuation of the upward trend.
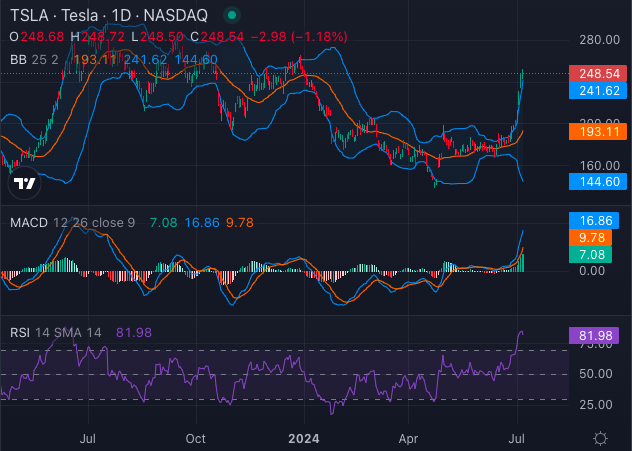
Chart created using Benzinga Pro
The Moving Average Convergence Divergence (MACD) indicator also supports the bullish outlook, showing a value of 16.86. Additionally, the Relative Strength Index (RSI) is at 81.98, indicating that the stock is overbought, which could suggest a near-term correction but also highlights the strong buying momentum.
The Bollinger Bands analysis further confirms the bullish trend with the 25-day Bands: $144.60 – $241.62, indicating a bullish trend. These bands suggest that Tesla is trading well above its typical range, reinforcing the idea that the stock is experiencing strong buying pressure.
The widening gap between the upper and lower bands for Tesla stock implies that the stock is experiencing wider price fluctuations, generally attributable to some economic and market news related to or impacting the stock.
The Verdict: Bullish Momentum May Continue
While analysts maintain a cautious outlook, Tesla's technical indicators paint a different picture, suggesting that the stock's bullish momentum may have more room to run. For investors eyeing Tesla, the technical analysis provides a compelling case for continued bullishness, even in the face of skeptical analyst projections.
Price Action: On last check, Tesla was trading at $251.17 per share, down 0.14%.
Read Next:
Edge Rankings
Price Trend
© 2025 Benzinga.com. Benzinga does not provide investment advice. All rights reserved.
date | ticker | name | Price Target | Upside/Downside | Recommendation | Firm |
|---|
Trade confidently with insights and alerts from analyst ratings, free reports and breaking news that affects the stocks you care about.

