
Zinger Key Points
- Amazon stock shows strong bullish signals with all major moving averages indicating a buy ahead of Prime Day.
- Technical indicators, including MACD and Bollinger Bands, suggest continued upward momentum for Amazon.com stock.
- Pelosi’s latest AI pick skyrocketed 169% in just one month. Click here to discover the next stock our government trade tracker is spotlighting—before it takes off.
Amazon.com, Inc. AMZN has been on a bullish run, with the stock up 57.30% over the past year and 31.62% year-to-date.
As the e-commerce giant gears up for its annual Prime Day event on July 16 and 17, let’s dive into the technicals to see what investors might expect.
Amazon’s Prime Day Anticipation
Prime Day is Amazon’s annual deal event exclusively for Prime members, offering two days of epic deals on top brands.
Indicators Point To Bullish Momentum For Amazon Stock
- Exponential Moving Averages (EMA): The share price is currently above its 5-, 20- and 50-day EMAs, indicating a strongly bullish trend despite some slight selling pressure.
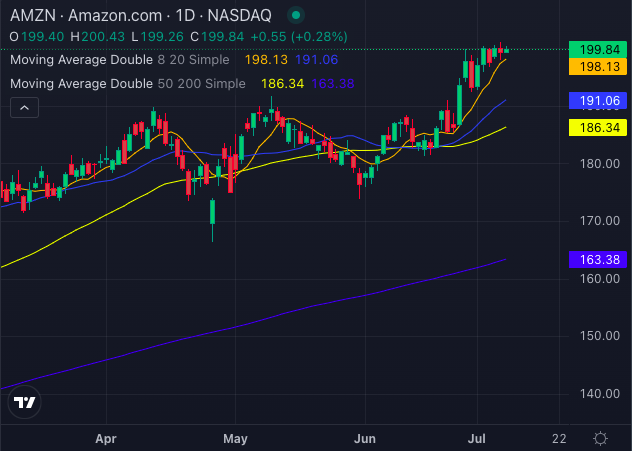
Chart created using Benzinga Pro
- Simple Moving Averages (SMA):
- The 8-day SMA is at $198.13, while the current share price is $199.84, signaling bullish momentum.
- The 20-day SMA stands at $191.06, below the stock price, reinforcing the bullish signal.
- The 50-day SMA is $186.34 compared to the share price of $199.84, is also signaling bullish sentiments from a technical perspective.
- The 200-day SMA is at $163.38, far below the current price, solidifying strong bullish momentum.
Read Also: Amazon, Qualcomm And A Consumer Cyclical Stock: CNBC’s ‘Final Trades’
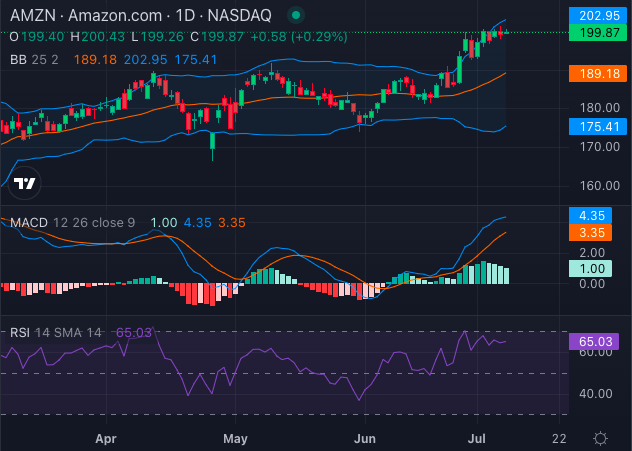
Chart created using Benzinga Pro
- MACD Indicator: The Moving Average Convergence Divergence (MACD) for Amazon stock is 4.35, indicating a bullish momentum and a buy signal.
- Relative Strength Index (RSI): The RSI is at 65.03, suggesting that Amazon stock is approaching overbought territory but still maintains a bullish signal.
- Bollinger Bands:
- The 25-day Bollinger Bands range between $175.41 and $202.95, placing the current share price of $199.84 above the upper band, which is a bullish signal.
As Amazon approaches its highly anticipated Prime Day, the technical indicators all point to continued bullish momentum for the stock.
Despite slight selling pressure and a high RSI, the alignment of EMAs, SMAs, MACD and Bollinger Bands all suggest that Amazon stock is poised for further gains.
Read Next:
Photo: Shutterstock
Edge Rankings
Price Trend
© 2025 Benzinga.com. Benzinga does not provide investment advice. All rights reserved.
Trade confidently with insights and alerts from analyst ratings, free reports and breaking news that affects the stocks you care about.

