
Zinger Key Points
- Trump Media shares surged 67% premarket, 35% in day trading, Monday- after a rally incident, but technicals show a bearish trend.
- While the price spike led moving averages to show bullish momentum, oscillators still indicate caution.
- Find out which stock just claimed the top spot in the new Benzinga Rankings. Updated daily— discover the market’s highest-rated stocks now.
Trump Media & Technology Group Corp. DJT shares have ignited, surging 27% on Monday morning.
This sharp rise follows a dramatic weekend event at an election rally in Pennsylvania, where former President Donald Trump narrowly escaped an assassination attempt. Following the incident, investor enthusiasm for Trump Media, which owns the Truth Social platform, appears to have increased amid heightened speculation about Trump’s prospects in the upcoming election.
Despite the rally, technical indicators present a more nuanced picture for DJT. Here's a breakdown:
Bullish Momentum Infused Into Trump Media Stock, Oscillators Spell Caution
Trump media stock price has risen above its 5, 20, and 50-day exponential moving averages (EMAs), indicating a strongly bearish trend with strong buying pressure evident as Trump’s winning odds strengthen.
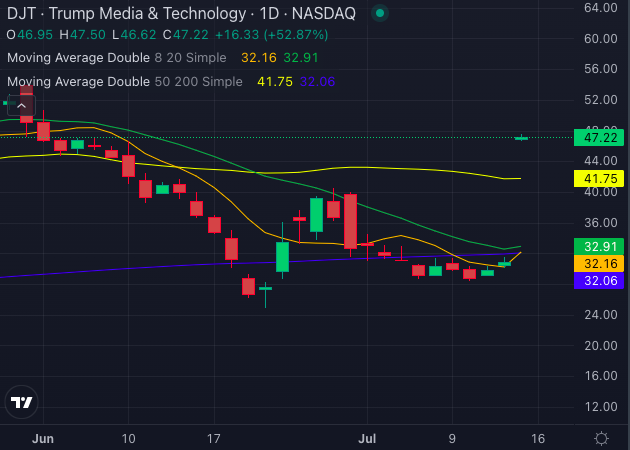
Chart created using Benzinga Pro
Moving Averages Analysis:
- 8-day Simple Moving Average (SMA): The share price of $47.22 is above the 8-day SMA of $32.16, signaling a bullish trend.
- 20-day SMA: At $47.22, the share price is above the 20-day SMA of $32.91, indicating a bullish outlook.
- 50-day SMA: The share price is also significantly above the 50-day SMA of $41.75, reinforcing the bullish sentiment.
- 200-day SMA: With the share price at $47.22 and the 200-day SMA at $32.06, the signal remains bullish.
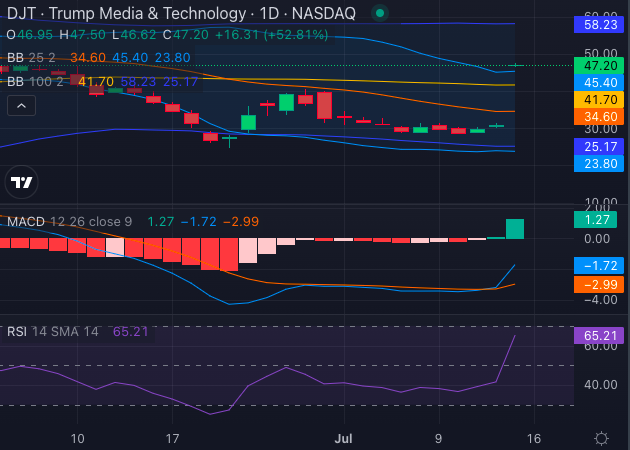
Chart created using Benzinga Pro
MACD Indicator: The Moving Average Convergence Divergence (MACD) indicator stands at -1.72, suggesting bearish momentum.
RSI Indicator: The Relative Strength Index (RSI) is at 65.21, indicating that the stock is approaching overbought conditions, which might suggest a potential selling opportunity if momentum changes.
Bollinger Bands:
- 25-period: The bands range between $23.80 and $45.40, with the stock trading in the lower band – suggesting the stock is currently in a bearish zone.
- 100-period: The bands range between $25.17 and $58.23, further indicating a bearish signal.
The recent news has increased attention to Trump Media's stock, to the extent that the technical indicators have turned mixed. However, while the momentum indicators are signaling bullishness, driven by the recent surge, the oscillators continue to send out bearish signals.
Investors should be mindful of the bearish signals dominating the technical landscape, despite the recent bullish price action.
Read Next:
Image created using artificial intelligence via Midjourney.
Edge Rankings
Price Trend
© 2025 Benzinga.com. Benzinga does not provide investment advice. All rights reserved.
Trade confidently with insights and alerts from analyst ratings, free reports and breaking news that affects the stocks you care about.

