Zinger Key Points
- Rivian's mixed technical signals reveal a short-term bearish trend, but Q2 earnings could potentially ignite a bullish reversal.
- Analysts predict a 20% upside for Rivian, hinging on Q2 earnings to validate their bullish forecasts.
- Get real-time earnings alerts before the market moves and access expert analysis that uncovers hidden opportunities in the post-earnings chaos.
Rivian Automotive Inc RIVN will be report second-quarter earnings on Tuesday after market hours.
Wall Street expects a negative $1.22 in earnings per share and $999.8 million in revenues.
Let’s look at what the charts indicate for Rivian stock, which is down 43% over the past year and down 37% year-to-date.
Rivian Technical Signals
Rivian stock’s technical indicators present a mixed outlook, showcasing both bullish and bearish signals.

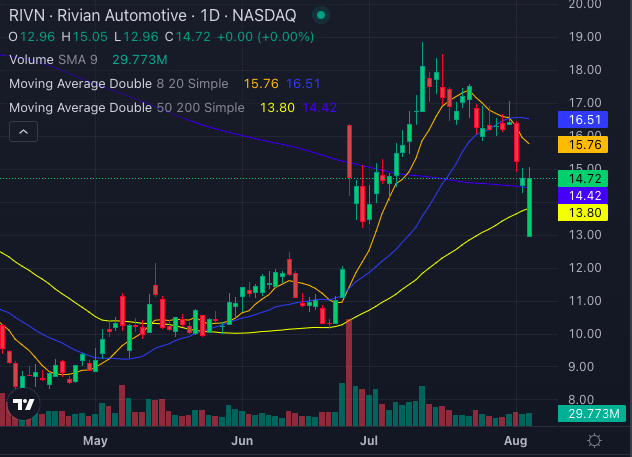
Chart created using Benzinga Pro
The stock is currently trading at $14.72, which falls below both its 8-day and 20-day simple moving averages (SMA) of $15.76 and $16.51, respectively, indicating a bearish trend in the short term.
However, when looking at the longer-term moving averages, the picture shifts. The 50-day SMA is at $13.80, and the 200-day SMA is at $14.42, both of which are below the current stock price, signaling a bullish outlook.

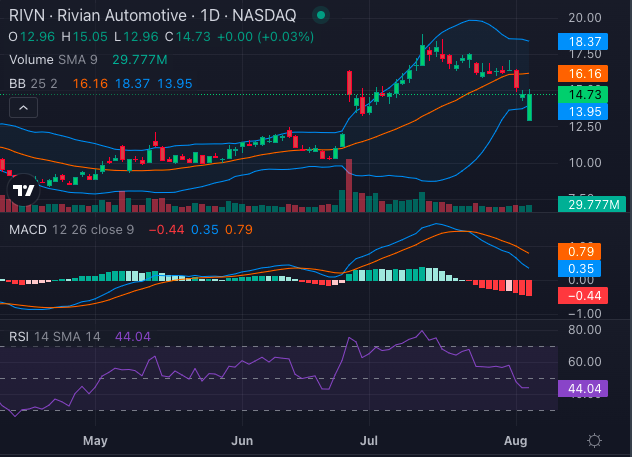
Chart created using Benzinga Pro
Analysts See 20% Upside
The Moving Average Convergence Divergence (MACD) indicator is at 0.35, suggesting a bullish momentum, while the Relative Strength Index (RSI) at 44.04 is heading towards the oversold zone under 30, it could present a potential buying opportunity for investors.
Additionally, the Bollinger Bands (25) range from $13.95 to $18.37, placing the current price just below the lower band, which could be interpreted as a bullish signal, suggesting the stock is undervalued at its current level.
Overall, while there are signs of slight buying pressure, the trend remains moderately bearish, with a blend of both bullish and bearish indicators influencing Rivian’s stock performance.
Rivian Ratings & Consensus Estimates: The consensus analyst rating on Rivian stock stands at a Buy currently with a price target of $19.58. The latest analyst ratings from Truist Securities, Cantor Fitzgerald, and Wells Fargo suggest a 19.94% upside for Rivian stock, with an average price target of $17.67.
RIVN Price Action: Rivian stock was trading at $14.77 at the time of publication.
Read Next:
© 2025 Benzinga.com. Benzinga does not provide investment advice. All rights reserved.
Trade confidently with insights and alerts from analyst ratings, free reports and breaking news that affects the stocks you care about.