
Zinger Key Points
- Joby Aviation's global expansion efforts show promise, but technical indicators suggest a cautious approach amidst bearish trends.
- Despite bullish news, Joby's stock faces technical challenges; investors should watch key indicators for potential opportunities.
- Markets are swinging wildly, but for Matt Maley, it's just another opportunity to trade. His clear, simple trade alerts have helped members lock in gains as high as 100% and 450%. Now, you can get his next trade signal—completely free.
Joby Aviation Inc. JOBY stock is catching the market’s attention with a 3.64% rise by 2:30 p.m. ET and was trading at $5.14 per share at last check Tuesday.
This surge comes on the back of exciting news that the company has formally applied for its revolutionary electric air taxi to be certified for use in Australia.
This move represents a significant step in Joby’s global expansion efforts, which also include ongoing certification processes with Japan’s Civil Aviation Bureau and the UK’s Civil Aviation Authority.
Read Also: Joby Applies for Aircraft Certification in Australia
The California-based company is making headlines with its innovative air taxi, designed to transport a pilot and four passengers at speeds of up to 200 mph. Boasting zero emissions and minimal noise compared to traditional helicopters, Joby is poised to transform urban air mobility.
“We’re incredibly excited about the potential for air taxis to offer new and more sustainable ways to travel,” stated JoeBen Bevirt, Founder and CEO of Joby. With over 33,000 miles of all-electric flight experience and a groundbreaking flight in Manhattan last year, Joby is leading the charge in the electric aviation sector.
Navigating Joby’s Bearish Terrain
While the news is promising, Joby Aviation’s technical indicators suggest a more cautious approach. Despite today’s bump, the stock is down 35.16% over the past year and 20.83% year-to-date, reflecting a bearish trend in its technical setup.
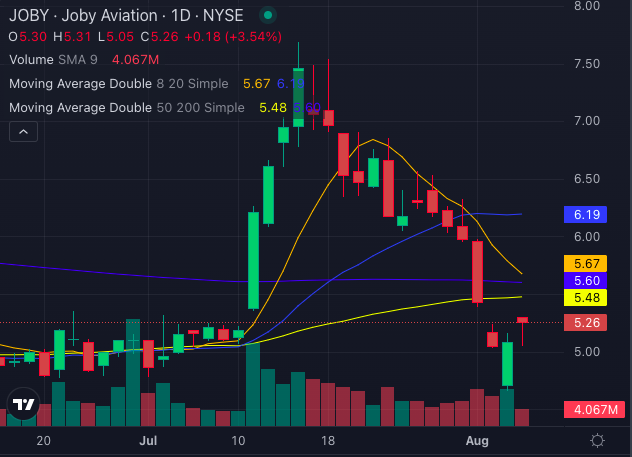
Currently, Joby trades below key moving averages, including the 5-day, 20-day, and 50-day exponential moving averages, indicating continued bearish pressure. The stock price of $5.26 remains beneath its 8-day simple moving average of $5.67 and the 20-day SMA of $6.19, both signaling further downward momentum.
Moreover, Joby’s 50-day SMA stands at $5.48 and the 200-day SMA at $5.60, both suggesting bearish signals.
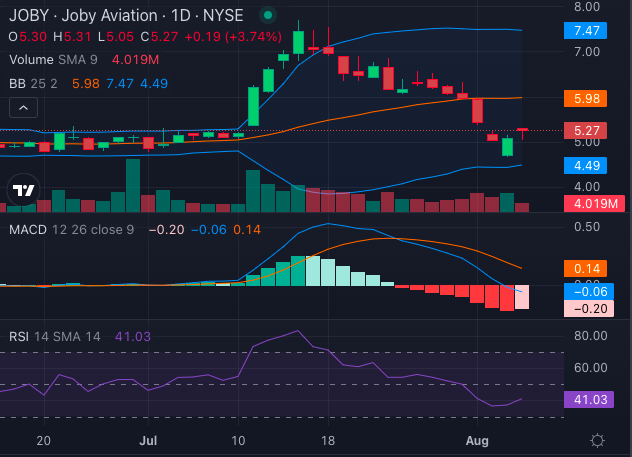
The Moving Average Convergence Divergence (MACD) indicator is at -0.06, underscoring the stock’s current weakness. However, with a Relative Strength Index (RSI) of 41.03, Joby stock has just recovered from the oversold territory, hinting at potential bullish opportunities for those willing to take a calculated risk.
Meanwhile, the Bollinger Bands (25), ranging from $4.49 to $7.47, reflect Joby’s continued volatility.
Joby Stock: High Hopes, Cautious Optimism
Joby Aviation’s push for global certification is a significant milestone, but the stock’s technical picture remains challenging.
While bullish news on the horizon could spur a turnaround, investors should be aware of the existing bearish pressures. Keeping an eye on key technical indicators will be crucial as Joby navigates these turbulent skies.
Read Next:
Edge Rankings
Price Trend
© 2025 Benzinga.com. Benzinga does not provide investment advice. All rights reserved.
Trade confidently with insights and alerts from analyst ratings, free reports and breaking news that affects the stocks you care about.

