Zinger Key Points
- Cisco stock faces strong bearish pressure, trading below key moving averages and signaling bearishness across technical indicators.
- Analysts maintain a Neutral rating on Cisco, with a consensus price target suggesting a potential 17.36% upside.
- Feel unsure about the market’s next move? Copy trade alerts from Matt Maley—a Wall Street veteran who consistently finds profits in volatile markets. Claim your 7-day free trial now.
Cisco Systems Inc CSCO is set to report its fourth-quarter earnings after market hours on Wednesday.
Wall Street expects 85 cents in EPS and $13.54 billion in revenues as the company reports
Let’s look at what the charts indicate for Cisco stock, which is down 16.18% over the last year and 10.58% year-to-date.
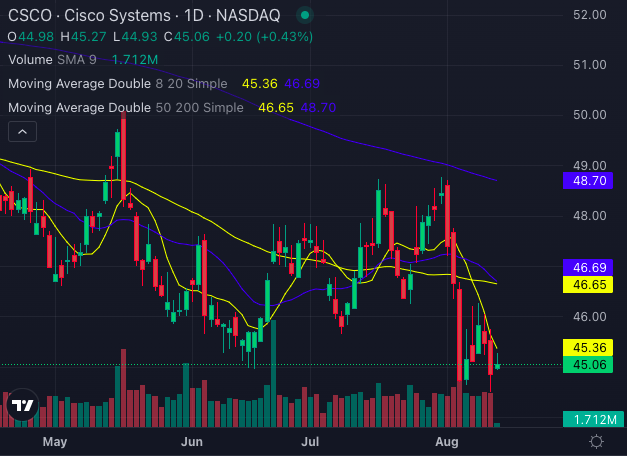
The share price of $45.06 is trading below its five-, 20- and 50-day exponential moving averages. This consistent positioning below key moving averages indicates significant selling pressure.

Chart created using Benzinga Pro
The stock is below its eight-day simple moving average of $45.36, 20-day SMA of $46.69 and 50-day SMA of $46.65, all of which signal bearishness.
The 200-day SMA stands at $48.70, further reinforcing the bearish outlook.

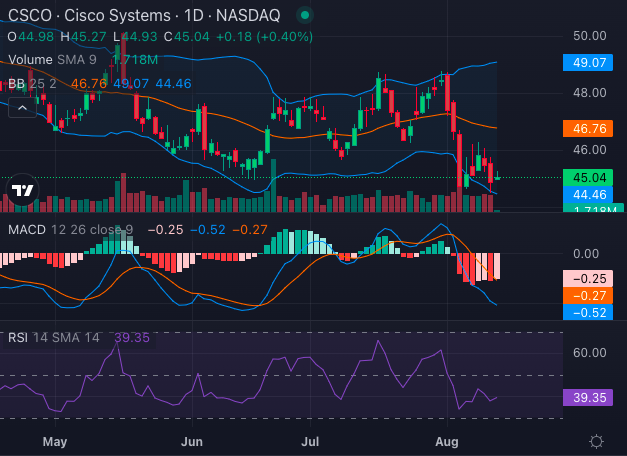
Chart created using Benzinga Pro
Technical indicators also suggest a negative sentiment. The Moving Average Convergence Divergence (MACD) is at negative 0.52, indicating a bearish signal.
The Relative Strength Index (RSI) of 39.35 suggests that the stock is near-about being oversold, but not yet in a position to reverse the downward trend.
Additionally, the Bollinger Bands, ranging from $44.46 to $49.07, place the current share price below the lower band, confirming the bearish sentiment.
Overall, Cisco Systems is experiencing strong selling pressure and technical indicators suggest a continued bearish outlook.
Read Also: What’s Going On With Cisco Stock?
Cisco Analysts See 17% Upside
The consensus analyst rating on Cisco stock stands at a Neutral with a price target of $56.39. The latest analyst ratings from Piper Sandler, Barclays and Wells Fargo imply a 17.36% upside for Cisco stock with a $53 average price target.
CSCO Price Action: Cisco stock was trading at $45.16 at the time of writing Tuesday.
Read Next:
Edge Rankings
Price Trend
© 2025 Benzinga.com. Benzinga does not provide investment advice. All rights reserved.
Trade confidently with insights and alerts from analyst ratings, free reports and breaking news that affects the stocks you care about.