
Zinger Key Points
- 3M's stock hits a 52-week high, with bullish technical indicators supporting its upward momentum.
- Despite strong gains, 3M’s RSI suggests the stock may be overbought, signaling potential for a short-term pullback.
- Get 5 stock picks identified before their biggest breakouts, identified by the same system that spotted Insmed, Sprouts, and Uber before their 20%+ gains.
Scotch Tape maker 3M Co MMM is on a roll.
The St. Paul, Minnesota-based company clocked a fresh 52-week high of $129.99 during Wednesday trading. 3M stock has seen a phenomenal 40.20% gain year-to-date, a hefty 56.56% rise over the past year and a solid 22.84% jump in the last month alone.
But, is the rally sustainable? Let’s take a look at what the charts have to say.
Bullish Technicals Fueling The Rally In 3M Stock
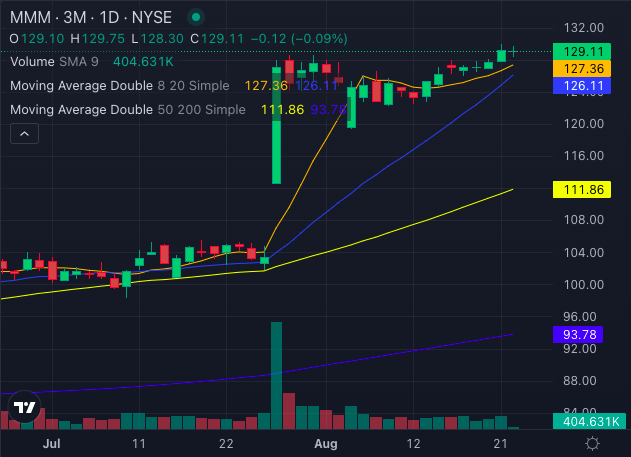
Chart created using Benzinga Pro
3M's technical indicators are signaling a strong bullish trend:
- Eight-Day SMA: The stock is trading above its eight-day simple moving average of $127.36, suggesting a strong bullish signal.
- 20-Day SMA: At $126.11, the stock’s price comfortably above this moving average further confirms bullish momentum.
- 50-Day SMA: With a price of $129.11 versus a 50-day SMA of $111.86, the trend remains robustly positive.
- 200-Day SMA: The stock's price well above the 200-day SMA of $93.78 continues to reinforce the bullish outlook.
Read Also: Why ARKK Stalled As QQQ Took Off: Harsh Lessons Over Past 5 Years
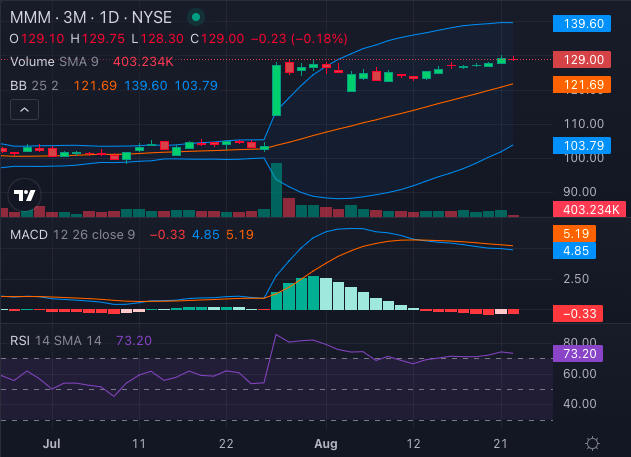
Chart created using Benzinga Pro
The Moving Average Convergence Divergence (MACD) indicator is showing a strong bullish signal at 4.85, supporting the overall positive trend.
Meanwhile, the Bollinger Bands (25), ranging from $103.79 to $139.60, have the stock trading within the upper bullish band — indicating bullishness. This aligns with the stock’s recent performance.
Caution: Overbought Concerns
Despite the bullish signals, 3M's Relative Strength Index (RSI) is at 73.20, placing the stock in overbought territory. This suggests that while the stock has performed exceptionally well, it might be ripe for a correction or a period of consolidation.
3M's stock is hitting new highs, driven by strong technical indicators and bullish moving averages.
However, with the RSI indicating overbought conditions, investors should be mindful of potential short-term adjustments.
Read Next:
Image: Shutterstock
© 2025 Benzinga.com. Benzinga does not provide investment advice. All rights reserved.
Trade confidently with insights and alerts from analyst ratings, free reports and breaking news that affects the stocks you care about.

