Zinger Key Points
- Ford's stock enters a bearish phase with a Death Cross, signaling potential further declines amid stalled EV plans.
- Technical indicators suggest Ford remains oversold, with bearish momentum continuing as EV strategy faces delays.
- China’s new tariffs just reignited the same market patterns that led to triple- and quadruple-digit wins for Matt Maley. Get the next trade alert free.
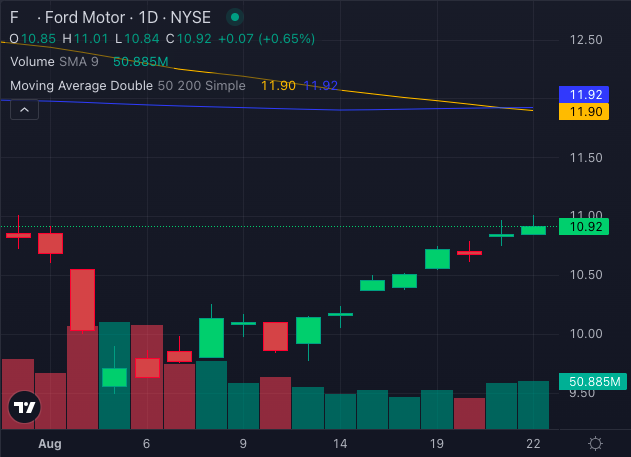
Ford Motor Co F has hit a rough patch, making a Death Cross on the charts. The stock has been cruising downhill, falling 8.7% YTD and experiencing a sharp 19% dip over the past month.
This technical signal suggests a bearish turn, and here’s why investors should buckle up.

Chart created using Benzinga Pro
Ford’s EV Roadblocks
In a recent turn of events, Ford has hit the brakes on its ambitious EV plans. The company has scrapped its three-row electric SUV and delayed the electric F-150's debut to 2027.
While the E-Transit van continues to drive EV sales, the delay in new electric offerings raises concerns about Ford’s future in the electric vehicle race.
The Death Cross Dilemma
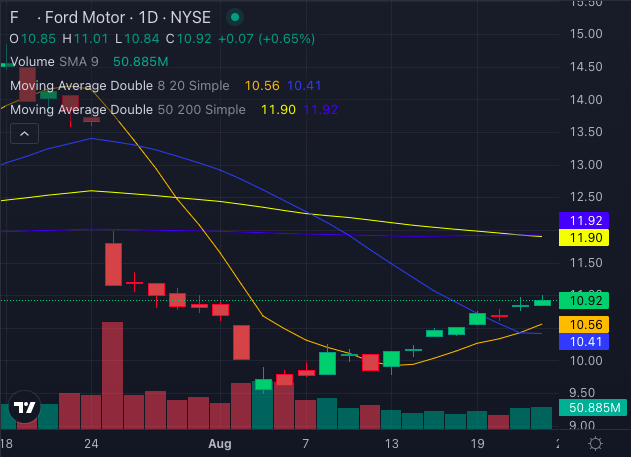
The Death Cross, where the 50-day SMA crosses below the 200-day SMA, spells trouble. Ford’s current stock price at $10.92 is trailing below its 50-day SMA of $11.90 and the 200-day SMA of $11.92, signaling potential further declines.

Chart created using Benzinga Pro
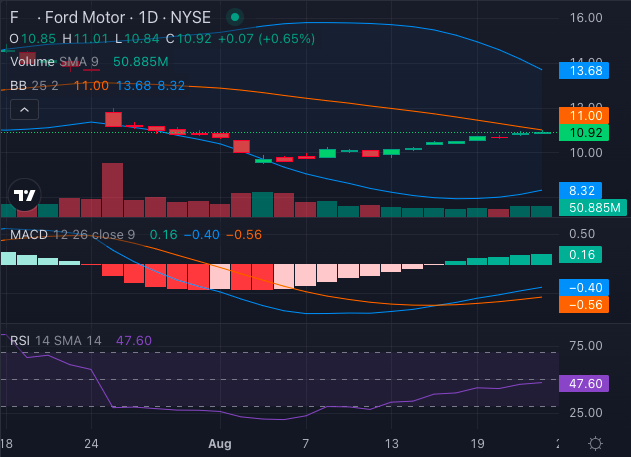
The Moving Average Convergence Divergence (MACD) indicator, at a negative 0.4, reinforces the bearish outlook.
Ford Stock Stuck In A Speed Trap
Ford’s stock is stuck in a stagnation zone with slight selling pressure.

Chart created using Benzinga Pro
The eight-day SMA and 20-day SMA at $10.56 and $10.41 respectively, indicate a buying opportunity, but this is overshadowed by the overall downtrend.
The Relative Strength Index (RSI) of 47.60 indicates a neutral condition, suggesting a lack of clear momentum rather than signaling an oversold or overbought market.
With Bollinger Bands showing a range of $8.32 – $13.68, the stock is trading in the lower band, suggesting a bearish signal.
Navigating Through Rough Terrain
Ford's stock is currently navigating through rough terrain with several technical indicators pointing towards a continued downtrend. While the E-Transit van is providing some positive momentum in the EV segment, the broader technical signals and recent setbacks suggest investors should approach Ford’s stock with caution.
Read Next:
Photo: Shutterstock
Edge Rankings
Price Trend
© 2025 Benzinga.com. Benzinga does not provide investment advice. All rights reserved.
Trade confidently with insights and alerts from analyst ratings, free reports and breaking news that affects the stocks you care about.