


Zinger Key Points
- Chevron stock shows bearish technical indicators, with a recent death cross suggesting potential downside risks ahead.
- Mixed technical signals and recent corporate moves make Chevron's stock outlook uncertain amid market and operational challenges.
- China’s new tariffs just reignited the same market patterns that led to triple- and quadruple-digit wins for Matt Maley. Get the next trade alert free.
Legendary investor Warren Buffett‘s oil pick – Chevron Corp CVX – is currently navigating choppy waters. Chevron, a titan in the global energy sector, is the fifth-largest holding of the “Oracle of Omaha’s” Berkshire Hathaway Inc BRK BRK portfolio.
The oil and gas giant, originally known as Standard Oil Company of California, operates in over 180 countries and has a storied history. However, recent technical signals suggest rough times ahead for Chevron stock.
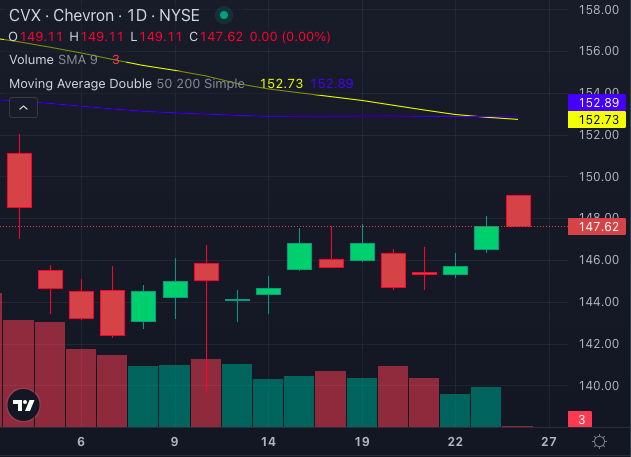
Chart created using Benzinga Pro
The recent formation of a Death Cross raises concerns for investors. With the stock down 1.24% year-to-date, 7.86% over the past year, and 6.47% in the last month, investors are left wondering: Is it time to pump the brakes?
Death Cross Signals A Potential Downturn – Time To Panic?
A death cross, a technical analysis pattern that occurs when the 50-day simple moving average (SMA) falls below the 200-day SMA, is often viewed as a bearish indicator signaling a potential downturn. This pattern recently emerged for Chevron stock, sparking concerns about the stock’s near-term trajectory.
But is the market overreacting, or should investors truly be wary?
Chevron’s Moving Averages: A Mixed Bag Of Signals
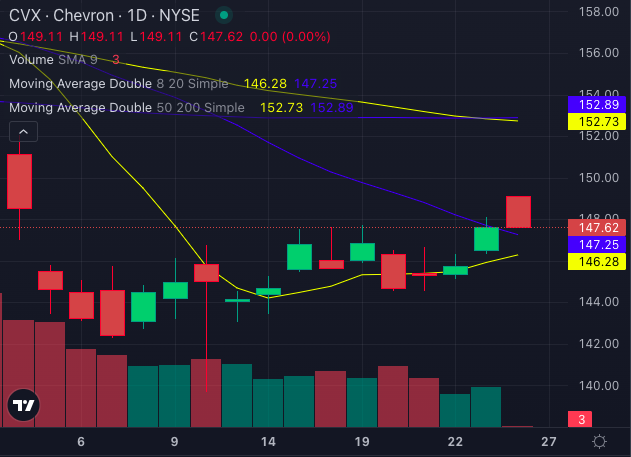
Chart created using Benzinga Pro
Looking at the moving averages, Chevron’s stock price sits at $147.62, below both its 50-day SMA of $152.73 and its 200-day SMA of $152.89, signaling a bearish outlook.
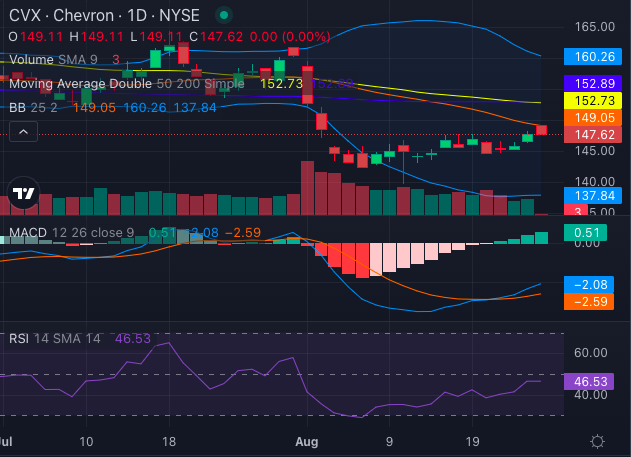
Chart created using Benzinga Pro
The Moving Average Convergence Divergence (MACD) indicator, a key momentum indicator, is at a negative 2.08, further supporting the bearish sentiment.
However, the stock's eight-day simple moving average is $146.28 and 20-day SMA is $147.25 – both below the current price at $147.62 – thereby, generating a bullish signal over the short term.
Read Also: Chevron Makes Deepwater Breakthrough with High-Pressure Anchor Project
Is Chevron Overbought Or Oversold? RSI Suggests A Middle Ground
Chevron’s Relative Strength Index (RSI), another key technical indicator, is at 46.53. This suggests the stock not quite in the danger zone of overselling. The RSI indicates a cautious stance; while there may be room for a rebound, the overall trend appears stagnant at best.
Is Volatility On The Horizon For CVX Stock?
The Bollinger Bands, set between $137.84 and $160.26, suggest that Chevron’s stock is trading in a relatively tight range, indicating potential for either a breakout or a further breakdown. Given the recent Death Cross, the likelihood leans towards the latter, with bearish momentum currently dominating. Moreover, the stock is currently trades in the lower bearish band.
Chevron’s Recent Moves: Strategic Shifts Amid Market Challenges
Chevron's recent news doesn’t help the bullish case either.
The company missed earnings expectations in early August due to lower refining margins and announced a relocation of its headquarters from California to Texas.
Furthermore, a delay in the Chevron-Hess deal due to an arbitration case with Exxon Mobil adds another layer of uncertainty to its future outlook.
Stay Cautious As Chevron Faces Technical, Market Headwinds
For investors, the recent Death Cross and bearish technical indicators signal caution.
While there are a few bullish signs, such as the eight and 20-day SMA, the overwhelming sentiment remains bearish. Investors may want to wait for a clearer trend to develop before making any significant moves.
Read Next:
Photo: Shutterstock
Edge Rankings
Price Trend
© 2025 Benzinga.com. Benzinga does not provide investment advice. All rights reserved.
Trade confidently with insights and alerts from analyst ratings, free reports and breaking news that affects the stocks you care about.

