
Zinger Key Points
- C3.ai stock is nearing a Death Cross, signaling a potential bearish trend amidst its evolving business strategy.
- Technical indicators suggest a bearish outlook for C3.ai, with the stock below key moving averages and oversold levels.
C3.ai Inc. AI, known for its innovative focus on enterprise artificial intelligence, is showing signs of trouble as its stock heads towards a Death Cross.
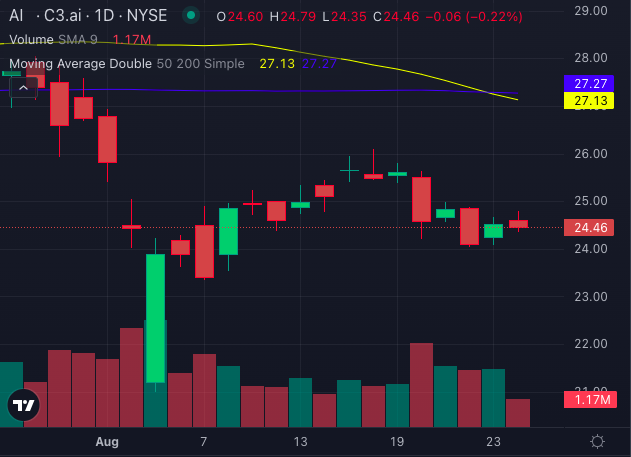
Chart created using Benzinga Pro
For those unfamiliar, a Death Cross occurs when a stock's short-term moving average crosses below its long-term moving average, often signaling a bearish trend. This technical indicator, coupled with other warning signs in C3.ai's trading patterns, suggests that investors may want to approach with caution.
The Pivots Of C3.ai: A Story Of Constant Evolution
Founded in 2009 by Thomas Siebel, C3.ai has undergone several transformations over the years. Initially launched as C3 Energy to serve the smart grid market, the company rebranded as C3 IoT in 2016 to capitalize on the growing Internet of Things (IoT) market.
However, its most significant shift occurred in 2019 when it pivoted towards artificial intelligence, rebranding as C3.ai. This final transition positioned it as a leader in AI and culminated in its public listing via a reverse merger with a special purpose acquisition company (SPAC), propelling its valuation to over $10 billion.
While adaptability is often seen as a strength, C3.ai’s frequent pivots have raised concerns about its long-term vision.
It prompts investors to wonder whether the company is genuinely committed to AI or simply following the latest market trends. These concerns are evident in the stock’s recent performance, with AI shares falling 15.07% year-to-date and declining 16.46% over the past year.
C3.ai Stock Chart Points To Further Downside
From a technical analysis perspective, C3.ai is currently facing several bearish signals. The stock is trading below its five, 20 and 50-day exponential moving averages, indicating a strongly bearish trend.
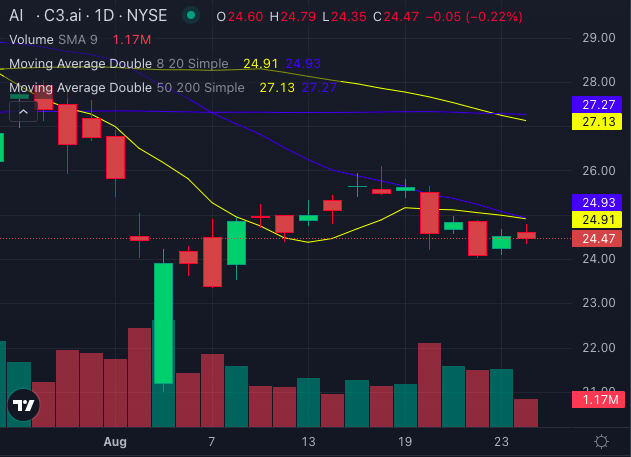
Chart created using Benzinga Pro
The share price is also below its eight-day simple moving average of $24.91 and 20-day SMA of $24.93, reinforcing the bearish sentiment. The 50-day SMA sits at 27.13 and the 200-day SMA is $27.27, both above the current price of $24.47, confirming the downtrend.
Read Also: Smart Money Is Betting Big In C3.ai Options
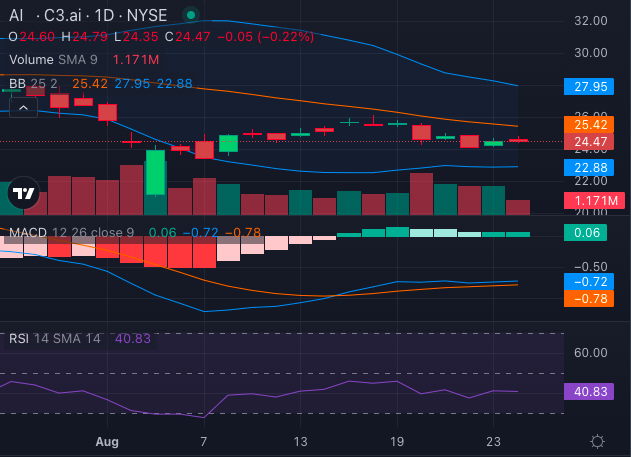
Chart created using Benzinga Pro
Other technical indicators like the Moving Average Convergence Divergence (MACD) at a negative 0.72 and the Relative Strength Index (RSI) of 40.83 suggest the stock is neither overbought nor oversold. So, it is not yet at levels that might trigger a significant buying spree.
Additionally, the Bollinger Bands (25) range between $22.88 and $27.95, suggesting limited upside movement in the near term as the stock continues to tread in the lower bearish band.
While some investors may see potential in C3.ai’s adaptability and ongoing focus on AI, the technical indicators suggest caution. As the stock teeters on the edge of a Death Cross, it may be prudent for investors to closely monitor the company’s next moves before deciding to jump in.
Read Next:
Photo: Shutterstock
© 2025 Benzinga.com. Benzinga does not provide investment advice. All rights reserved.
Trade confidently with insights and alerts from analyst ratings, free reports and breaking news that affects the stocks you care about.

